Verified statistics on how much Europeans meet, how that has changed since 2019, what meetings cost and which rules govern always-on work. Every figure is traced to its original publisher.
This page collects verified statistics on workplace meetings in Europe: how many people meet remotely, how meeting load changed since 2019, how much meeting time is wasted, what an hour of meeting costs, and which rules govern always-on work. Every figure was checked on its publisher's own page on 13 September 2026. Geographic scope: the EU-27, the United Kingdom, the Nordic countries and the Baltic states, with EU-wide and country figures wherever a primary source publishes them.
Key takeaways
- 23.3% of employed people aged 20–64 in the EU usually or sometimes worked from home in 2025, up from 14.7% in 2019 (Eurostat, EU Labour Force Survey, 2025 data released 2026).
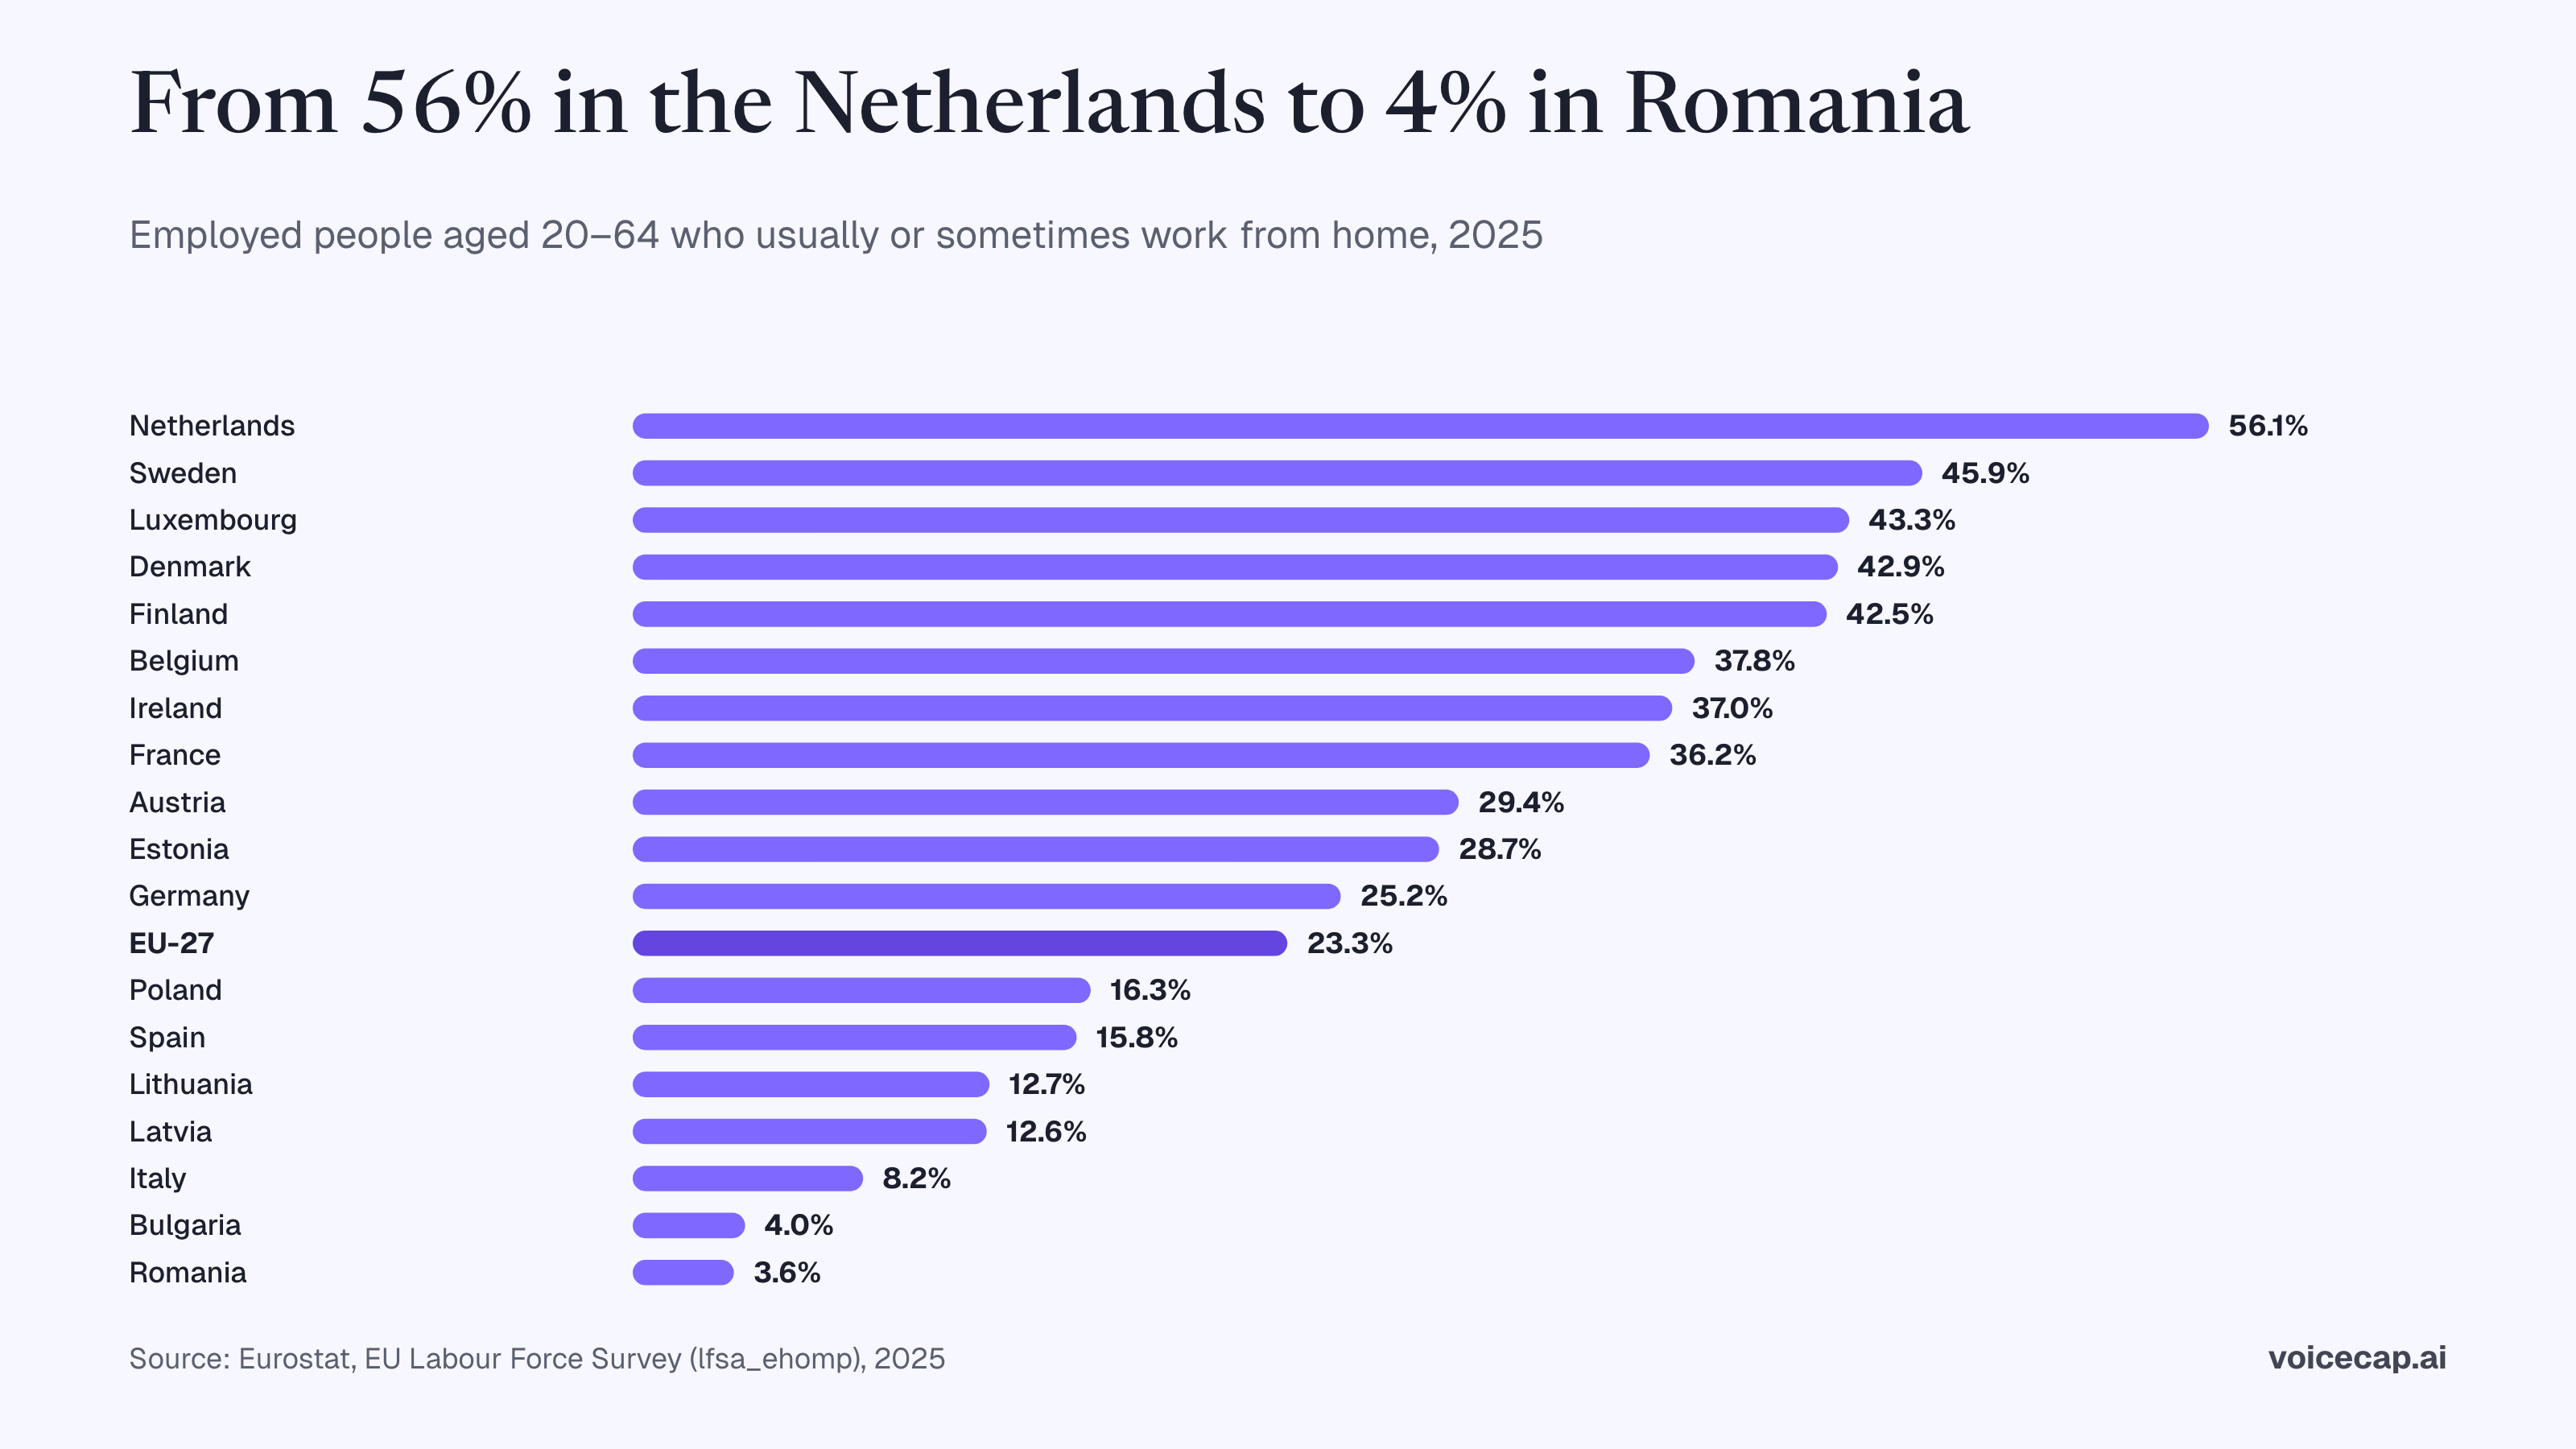
- The Netherlands leads the EU with 56.1% of employed people working from home at least sometimes; Romania is lowest at 3.6% (Eurostat, 2025).
- 60% of managers and 57% of professionals in the EU telework, against 3% of all employees who telework full time (Eurofound, European Working Conditions Survey 2024).
- 52.9% of EU enterprises with 10 or more employees held remote meetings via the internet in 2024; Finland leads at 84.5% (Eurostat, 2024).
- Weekly time in Microsoft Teams meetings rose 252% between February 2020 and February 2022 for the average user (Microsoft Work Trend Index, telemetry, 2022).
- 57% of meetings are ad hoc calls without a calendar invite, and meetings after 8 pm are up 16% year on year (Microsoft Work Trend Index, telemetry, 2025).
- After the 2020 lockdowns, meetings per person per day rose 12.9% while average meeting length fell 20.1%, in telemetry from 3.1 million users across 16 cities including Paris, London, Milan, Madrid, Brussels and Oslo (NBER Working Paper 27612, 2020).
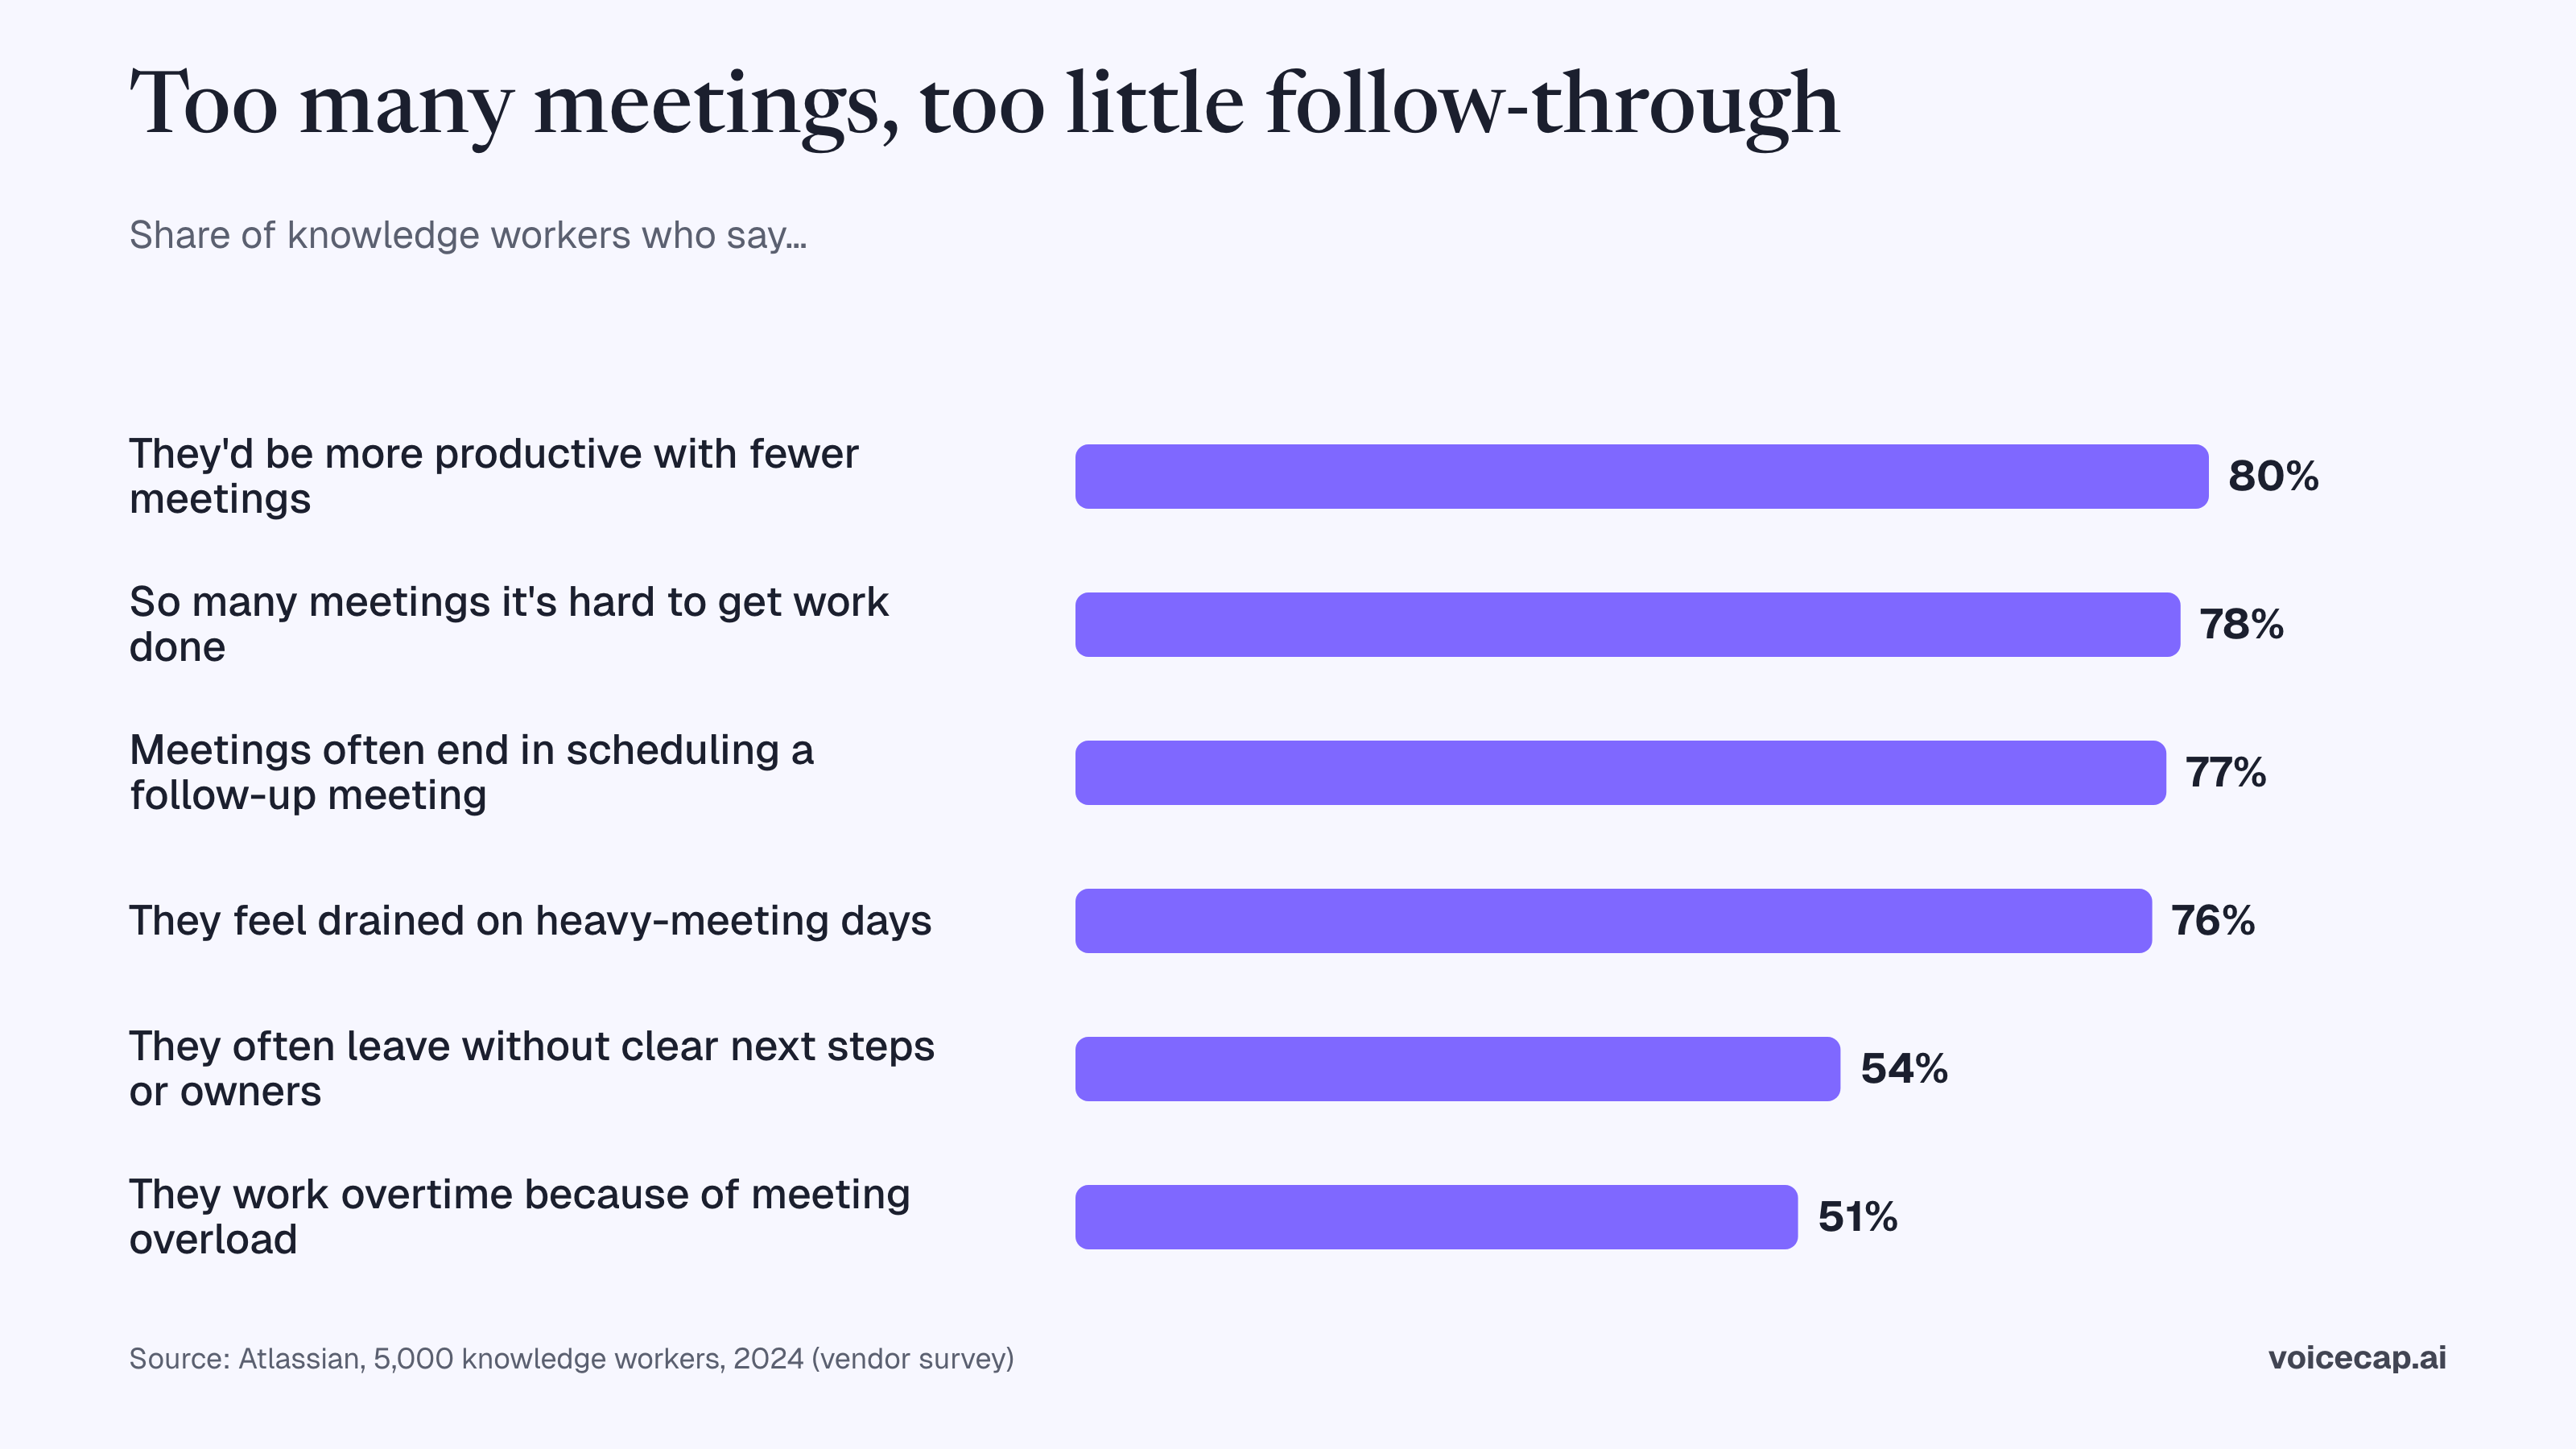
- Meetings are ineffective 72% of the time, and 54% of workers frequently leave meetings without a clear idea of next steps or who owns which task (Atlassian, 5,000 knowledge workers, 2024).
- Once meetings take up more than two hours a day, a majority of desk workers feel overburdened; 55% of executives say they spend too much time in meetings (Slack Workforce Index, 10,333 workers in six countries including UK, Germany and France, 2023).
- Executives spend an average of nearly 23 hours a week in meetings, up from less than 10 hours in the 1960s (Perlow, Hadley and Eun, Harvard Business Review, 2017).
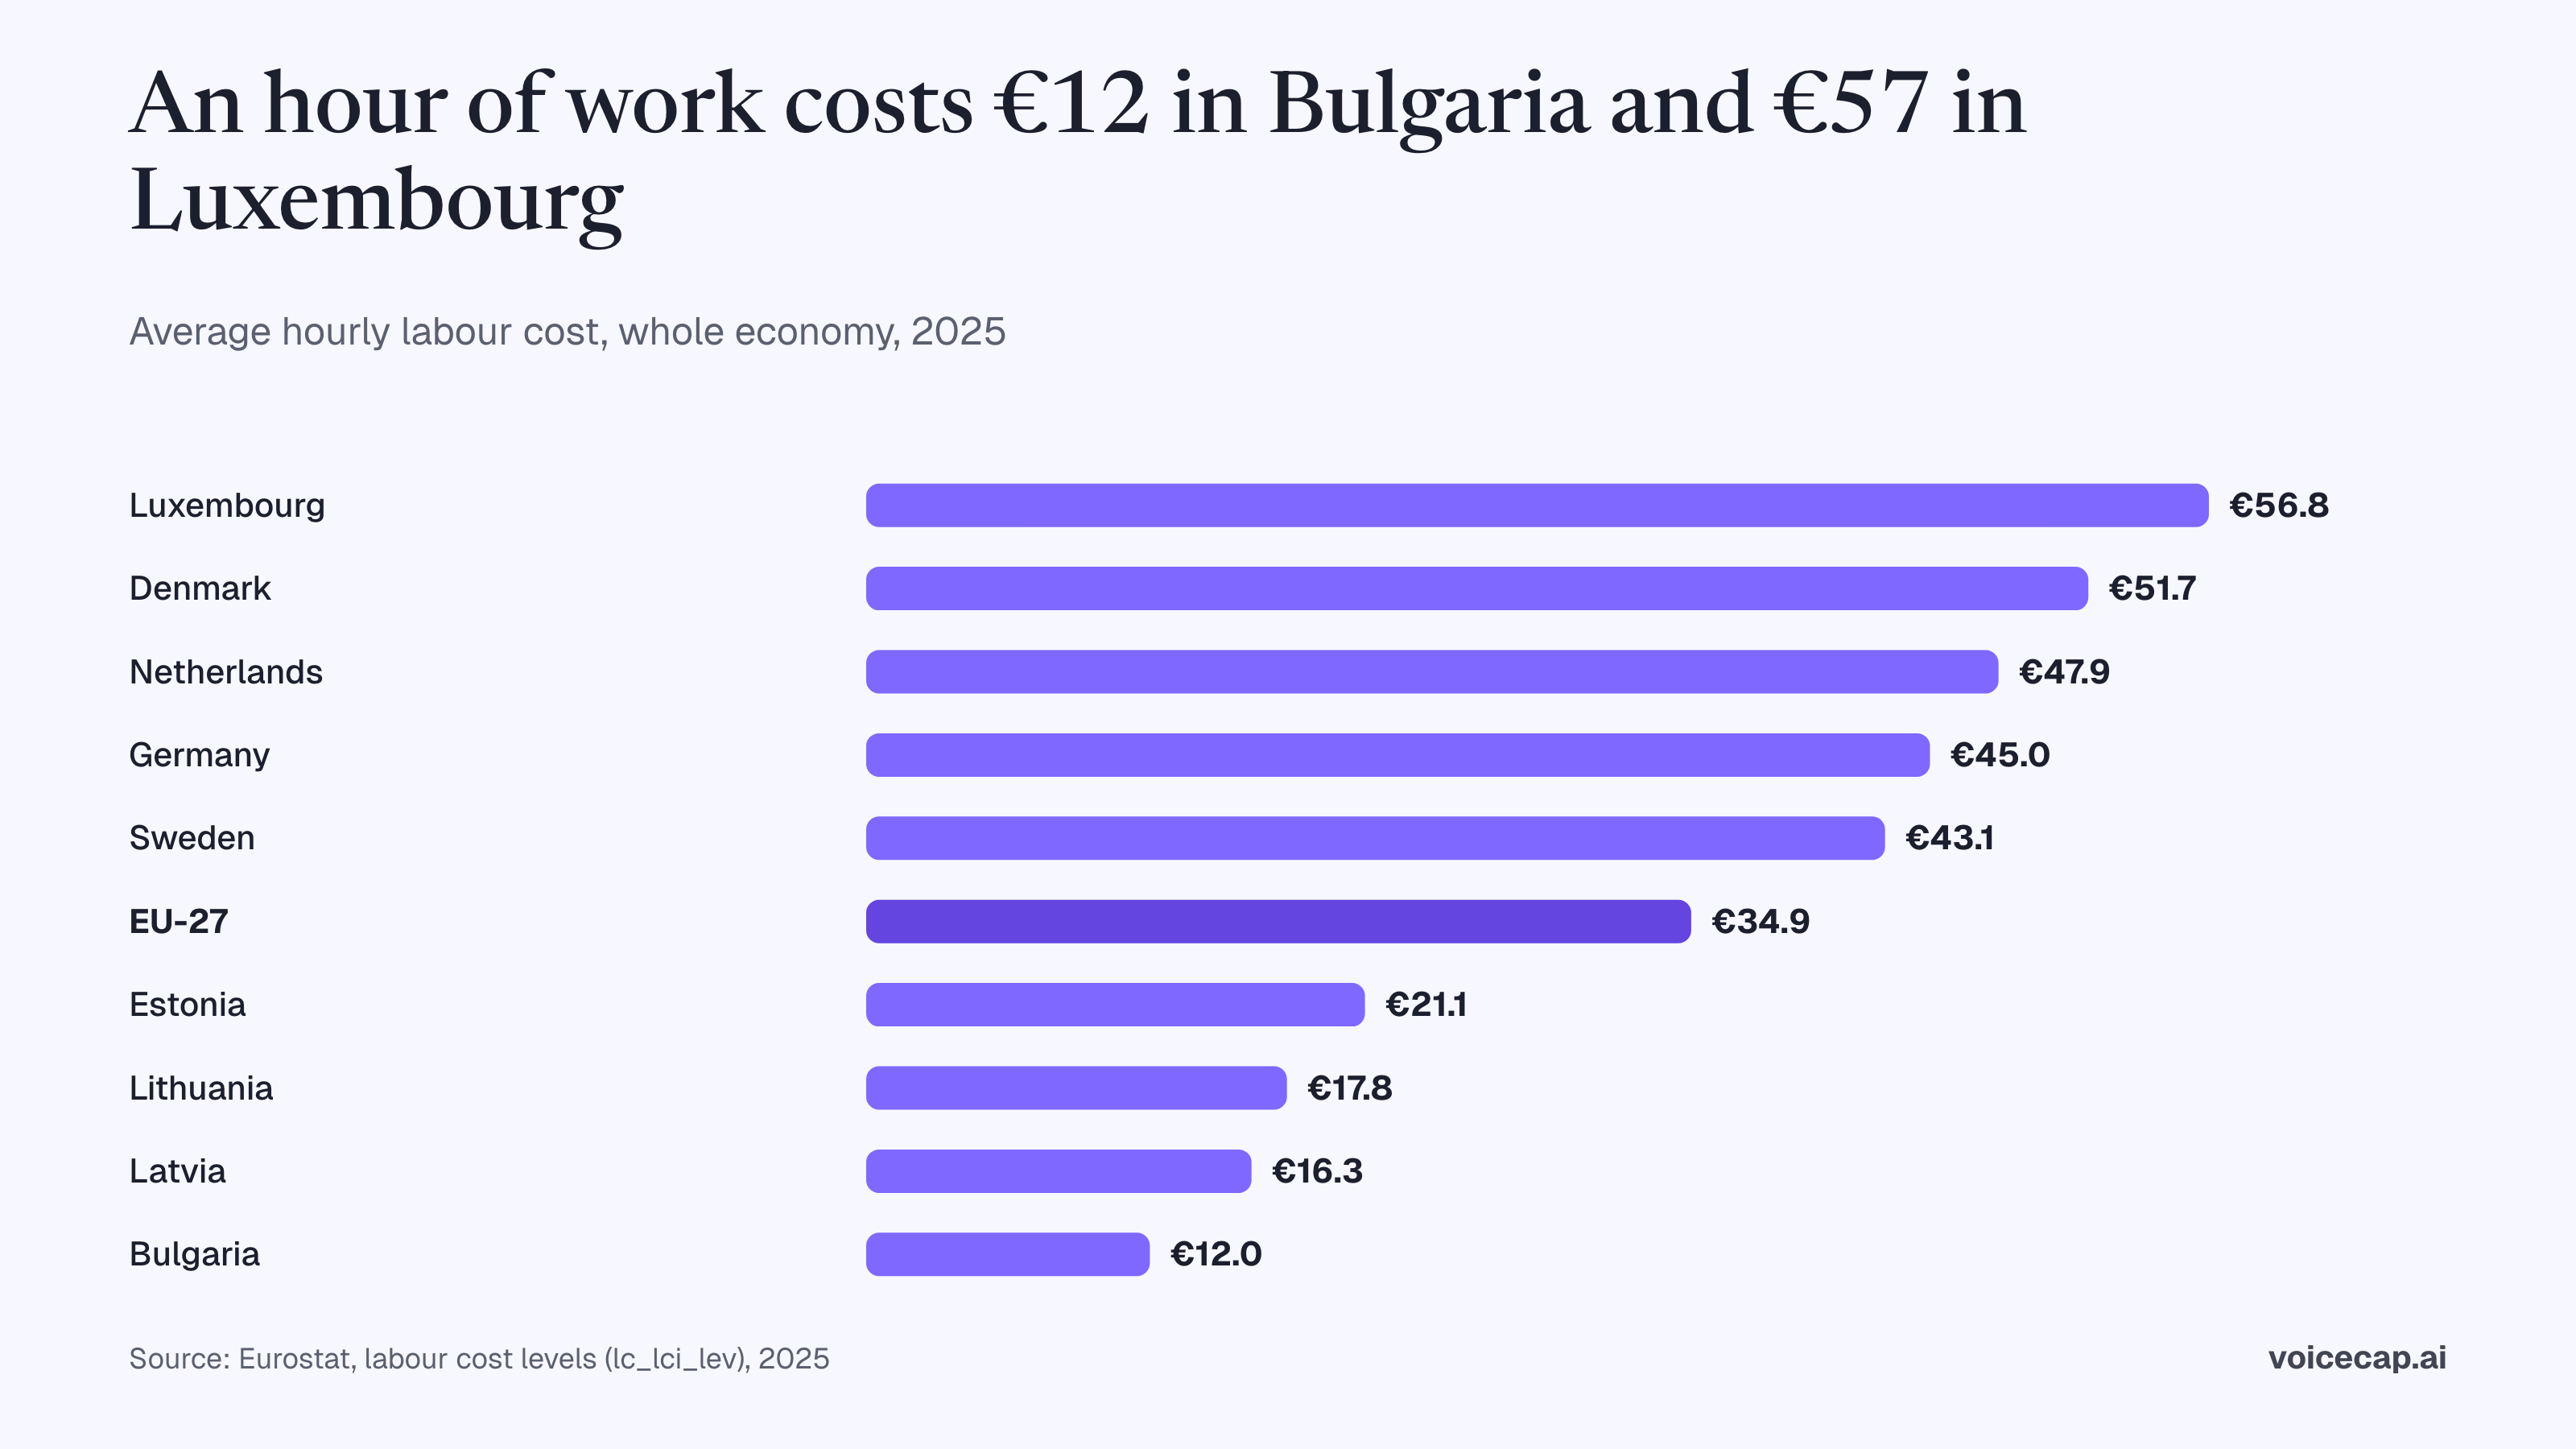
- An hour of labour cost €34.9 on average in the EU in 2025, ranging from €12.0 in Bulgaria to €56.8 in Luxembourg, with Lithuania at €17.8 and Germany at €45.0 (Eurostat, 2025).
- 13 EU Member States had right-to-disconnect legislation as of July 2025, up from nine in June 2023 (European Commission consultation document C(2025) 7020; Eurofound 2023).
- 44% of EU teleworkers worked overtime in 2021, 14 percentage points more than on-site workers in comparable occupations (Eurofound EWCS 2021, cited by the European Commission, 2025).
- 28% of working adults in Great Britain hybrid worked in January–March 2025, and 45% of managers, directors and senior officials did so in autumn 2024 (Office for National Statistics, 2025 and 2024).
Methodology
How sources were chosen. We accepted only original producers of data: statistical offices (Eurostat, OECD, ONS, Destatis, INSEE, CBS, SCB, SSB, Statistics Denmark, Statistics Finland, the Central Statistical Bureau of Latvia), EU agencies (Eurofound, EU-OSHA, the Joint Research Centre), the European Commission and EUR-Lex, peer-reviewed or working-paper research (NBER, IZA, Nature Human Behaviour, Human Resource Management), research organisations that collected their own data (Gallup, CIPD, Bitkom, CFA Institute, NHS England) and software vendors only where the vendor itself collected the data and publishes a dated methodology with a sample size (Microsoft Work Trend Index, Slack Workforce Index, Atlassian, Owl Labs, Doodle). Stats roundups, blogs, listicles and second-hand "according to" quotes were rejected. Meeting-assistant vendors were not used as sources for any market or behavioural statistic.
How numbers were verified. Each source was opened on 13 September 2026 and the figure was confirmed on that page or inside that PDF. Eurostat and OECD figures were pulled from the publishers' own dissemination APIs (dataset codes are given in the source list) so a reader can reproduce the query. Where a source is paywalled, the source list says so. Figures we could not open were dropped and are listed under Gaps.
How to read the labels. "Vendor survey" marks data from a software company's own research programme. "Telemetry" marks aggregated product-usage data rather than a questionnaire. Data collected before 2023 is labelled "older" and used only where nothing newer exists. Two figures in the cost section are our arithmetic on published inputs and are labelled "derived".
How many Europeans work from home, and where?
Almost one in four employed people in the EU worked from home at least sometimes in 2025, and the country range runs from 3.6% to 56.1%.
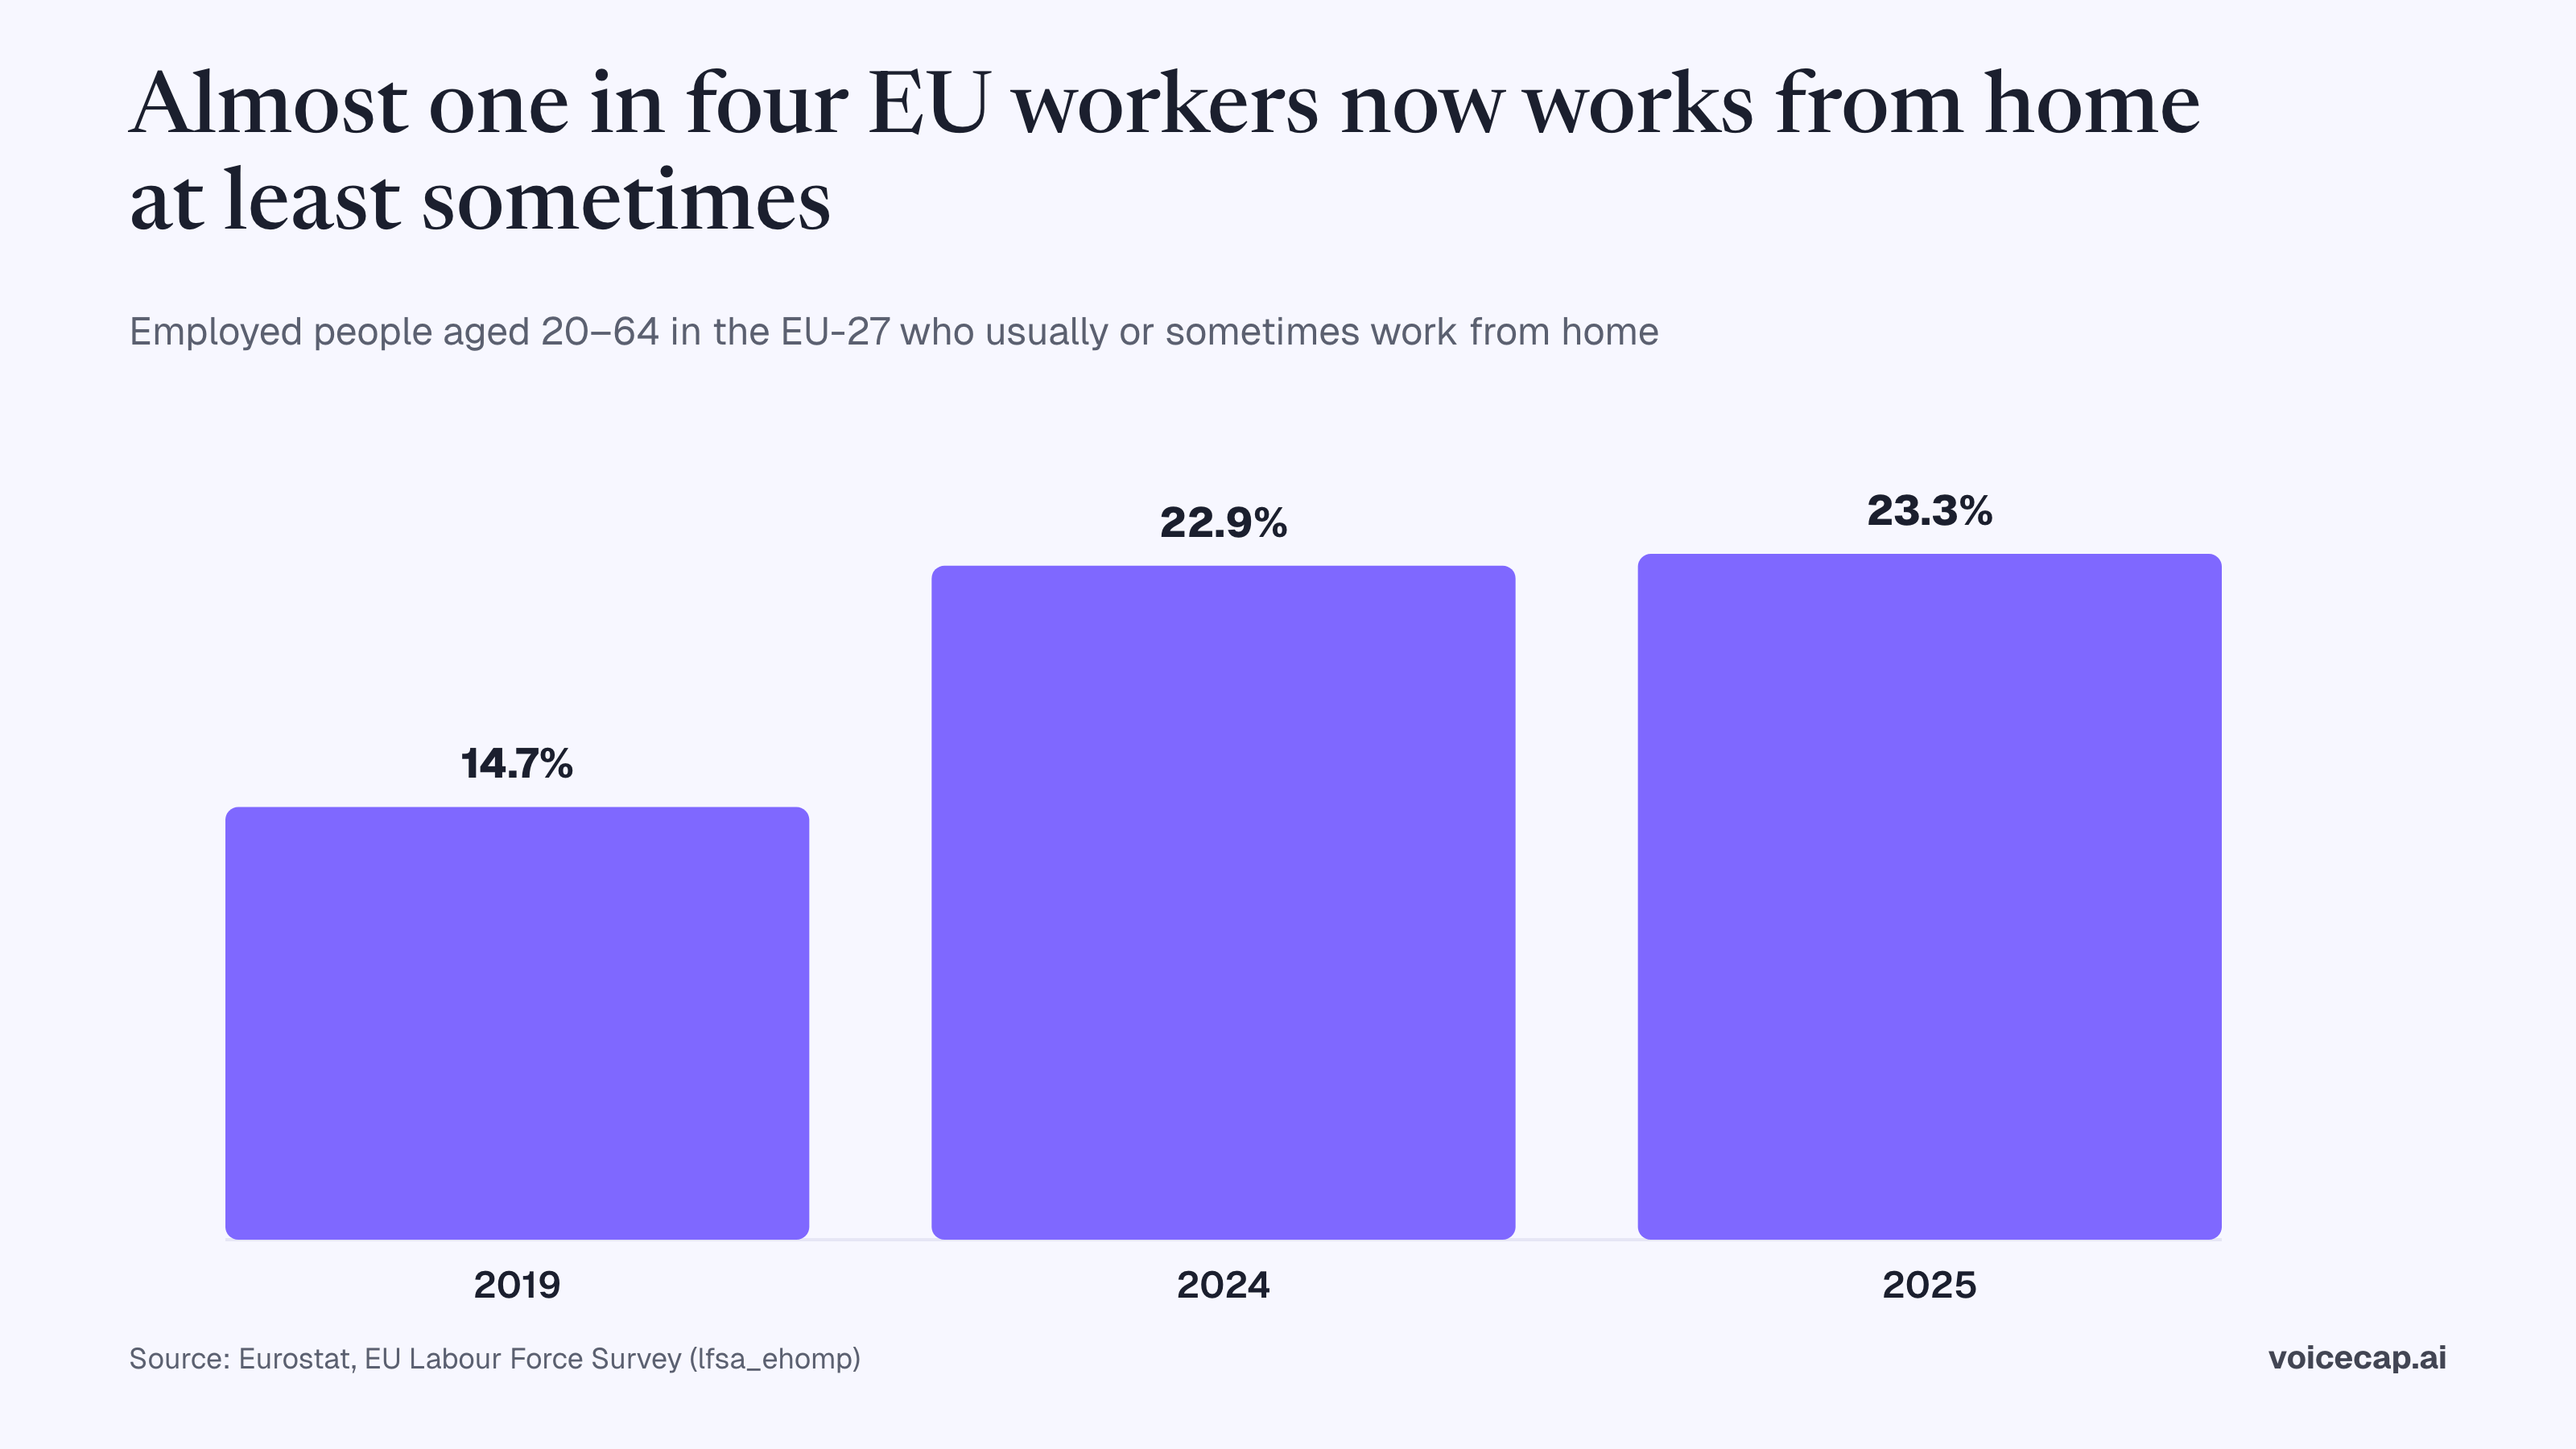
- 23.3% of employed people aged 20–64 in the EU-27 usually (8.9%) or sometimes (14.4%) worked from home in 2025 (Eurostat, EU-LFS lfsa_ehomp, data updated June 2026).
- 14.7% was the 2019 baseline for the same indicator (5.5% usually, 9.2% sometimes), and 22.9% was the 2024 value (Eurostat, same dataset).
- The European Commission summarises the same series as "Telework has doubled in the EU since 2019, with one in five Europeans (20.3%) working from home at least part of their time in 2024" and, in its consultation document, as 21.9% in 2021 against 11.1% in 2019 (European Commission, 25 July 2025; the Commission figures use a different age band from the 20–64 series above).
- Country shares of employed people aged 20–64 working from home usually or sometimes, 2025 (Eurostat, same dataset): Netherlands 56.1%, Sweden 45.9%, Luxembourg 43.3%, Denmark 42.9%, Finland 42.5%, Belgium 37.8%, Ireland 37.0%, France 36.2%, Austria 29.4%, Estonia 28.7%, Germany 25.2%, Poland 16.3%, Spain 15.8%, Lithuania 12.7%, Latvia 12.6%, Italy 8.2%, Bulgaria 4.0%, Romania 3.6%.
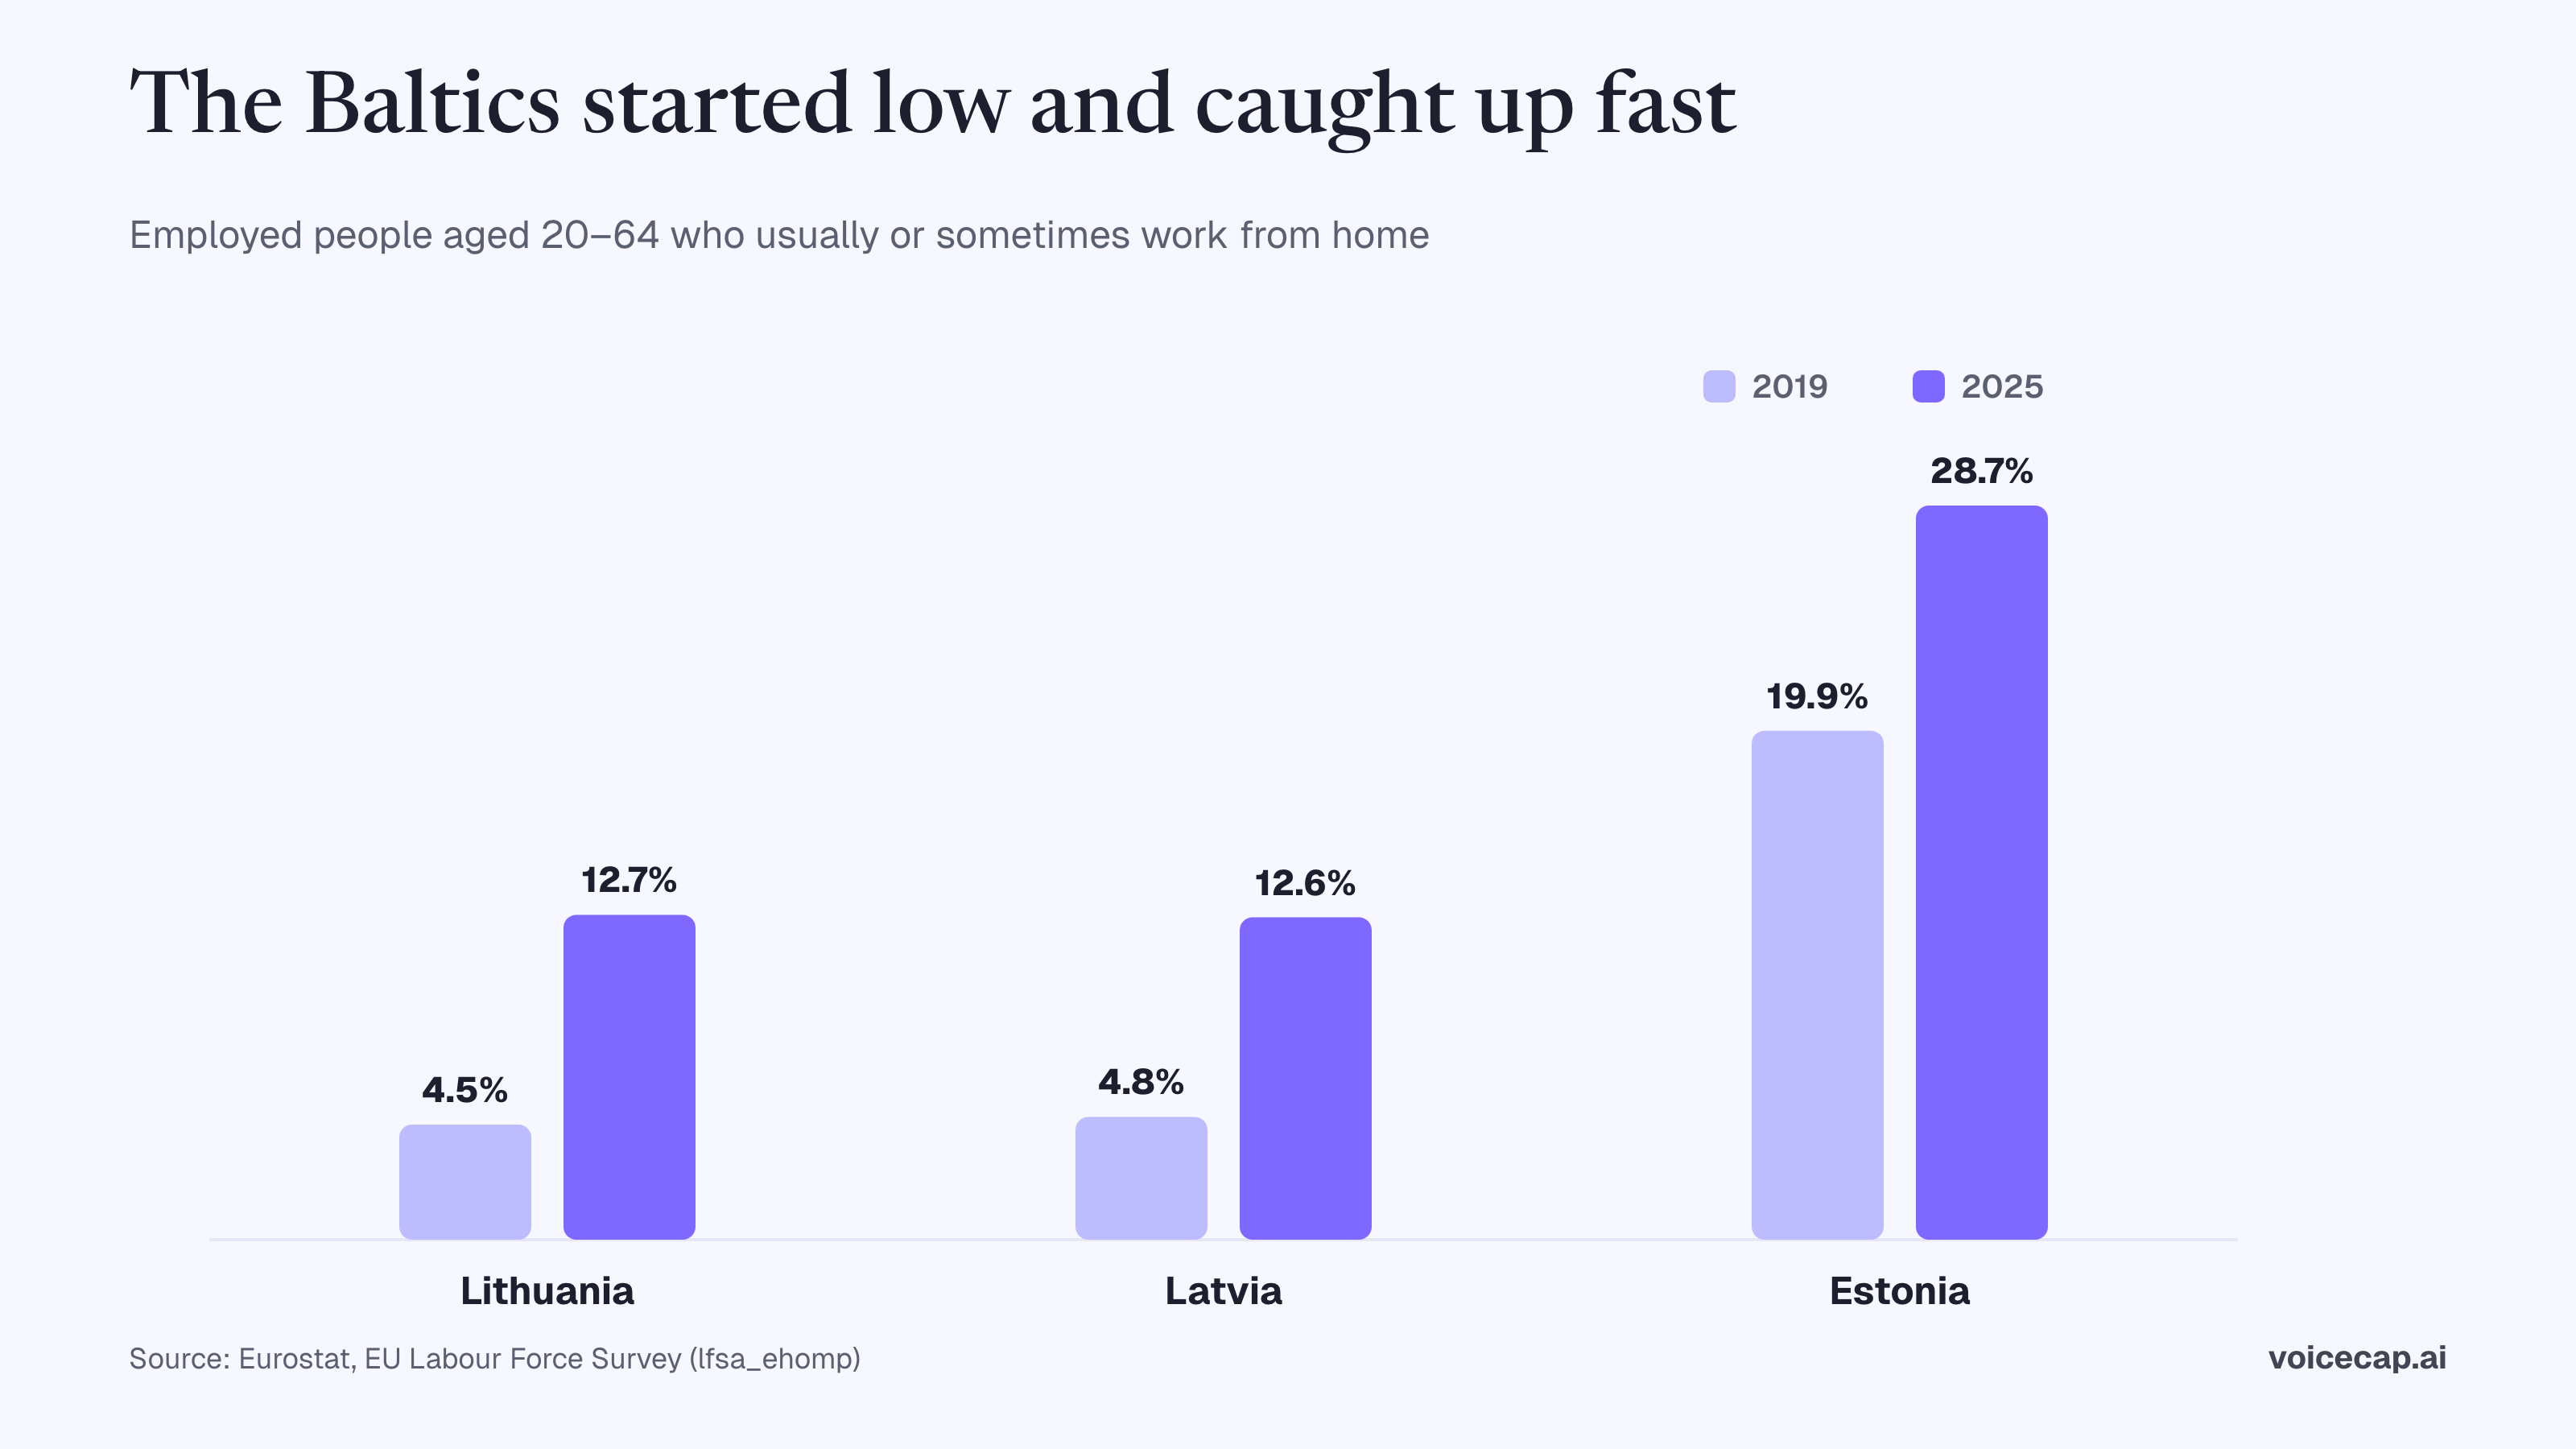
- Lithuania and Latvia started from a far lower base than Estonia: 4.5% and 4.8% in 2019, against Estonia's 19.9% (Eurostat, same dataset, 2019).
- 37% of EU-27 employees are in occupations that can technically be done from home (European Commission Joint Research Centre, "Who can telework today?", 2020; older).
Country statistical offices publish their own definitions, which is why their headline figures differ from Eurostat's harmonised series.
What do national statistics offices report on hybrid work?
National offices confirm the same ranking: the Netherlands and the Nordics highest, the Baltics and Southern Europe lowest, Germany and France in between.
- United Kingdom: 28% of working adults in Great Britain hybrid worked between 8 January and 30 March 2025. Workers with a degree were 41% hybrid against 4% with no qualifications; 45% of those earning £50,000 or more hybrid worked against 8% of those under £20,000; 36% of 30–49 year olds hybrid worked, against 19% of 16–29 year olds (ONS, Opinions and Lifestyle Survey, June 2025).
- United Kingdom, by occupation: 45% of managers, directors and senior officials followed a hybrid pattern in autumn 2024, against 27% of all workers and 3% in elementary occupations; working parents hybrid worked more (35%) than non-parents (24%) (ONS, November 2024).
- United Kingdom, employers: 74% of organisations had hybrid working in place in 2025, down from 84% in 2023 (CIPD, fieldwork 14 April–5 May 2025).
- Germany: 25% of all employed people worked from home at least occasionally in 2025 (Destatis, April 2026). The ifo Institute's firm survey put the employee share at 24.5% in February 2025, against 23.4% in August 2024 (ifo Institute, March 2025).
- France: 22% of private-sector employees teleworked at least once a month in the first half of 2024, averaging 1.9 days a week when they did (INSEE, 2024).
- Netherlands: more than 5 million people, 52% of all workers, worked from home sometimes or mostly in 2023, which CBS states is the highest share of any EU member state (CBS, November 2024).
- Sweden: about 46% of employed people aged 20–64 reported working from home to some extent in 2024 (Statistics Sweden, 2025).
- Norway: 45% of employed people had the option to work from home in 2024, and 7% worked from home for half or more of their working time in both 2023 and 2024 (Statistics Norway, 2025).
- Denmark: four out of ten employed people had worked from home within the previous four weeks in Q2 2024 (Statistics Denmark, 2024).
- Finland: in 2024, about 7% of employed people worked entirely from home, 12% worked at least half their time from home, and 55% (1,443,000 people) did not work from home at all (Statistics Finland, 2025).
- Latvia: 11.6% of employees aged 15–74, or 87.9 thousand people, worked remotely in 2024, up from 10.6% in 2023 (Central Statistical Bureau of Latvia, 2025).
Is hybrid replacing fully remote work?
Yes. Fully remote work among Europeans in teleworkable jobs fell by ten percentage points between 2022 and 2024 while hybrid held steady.
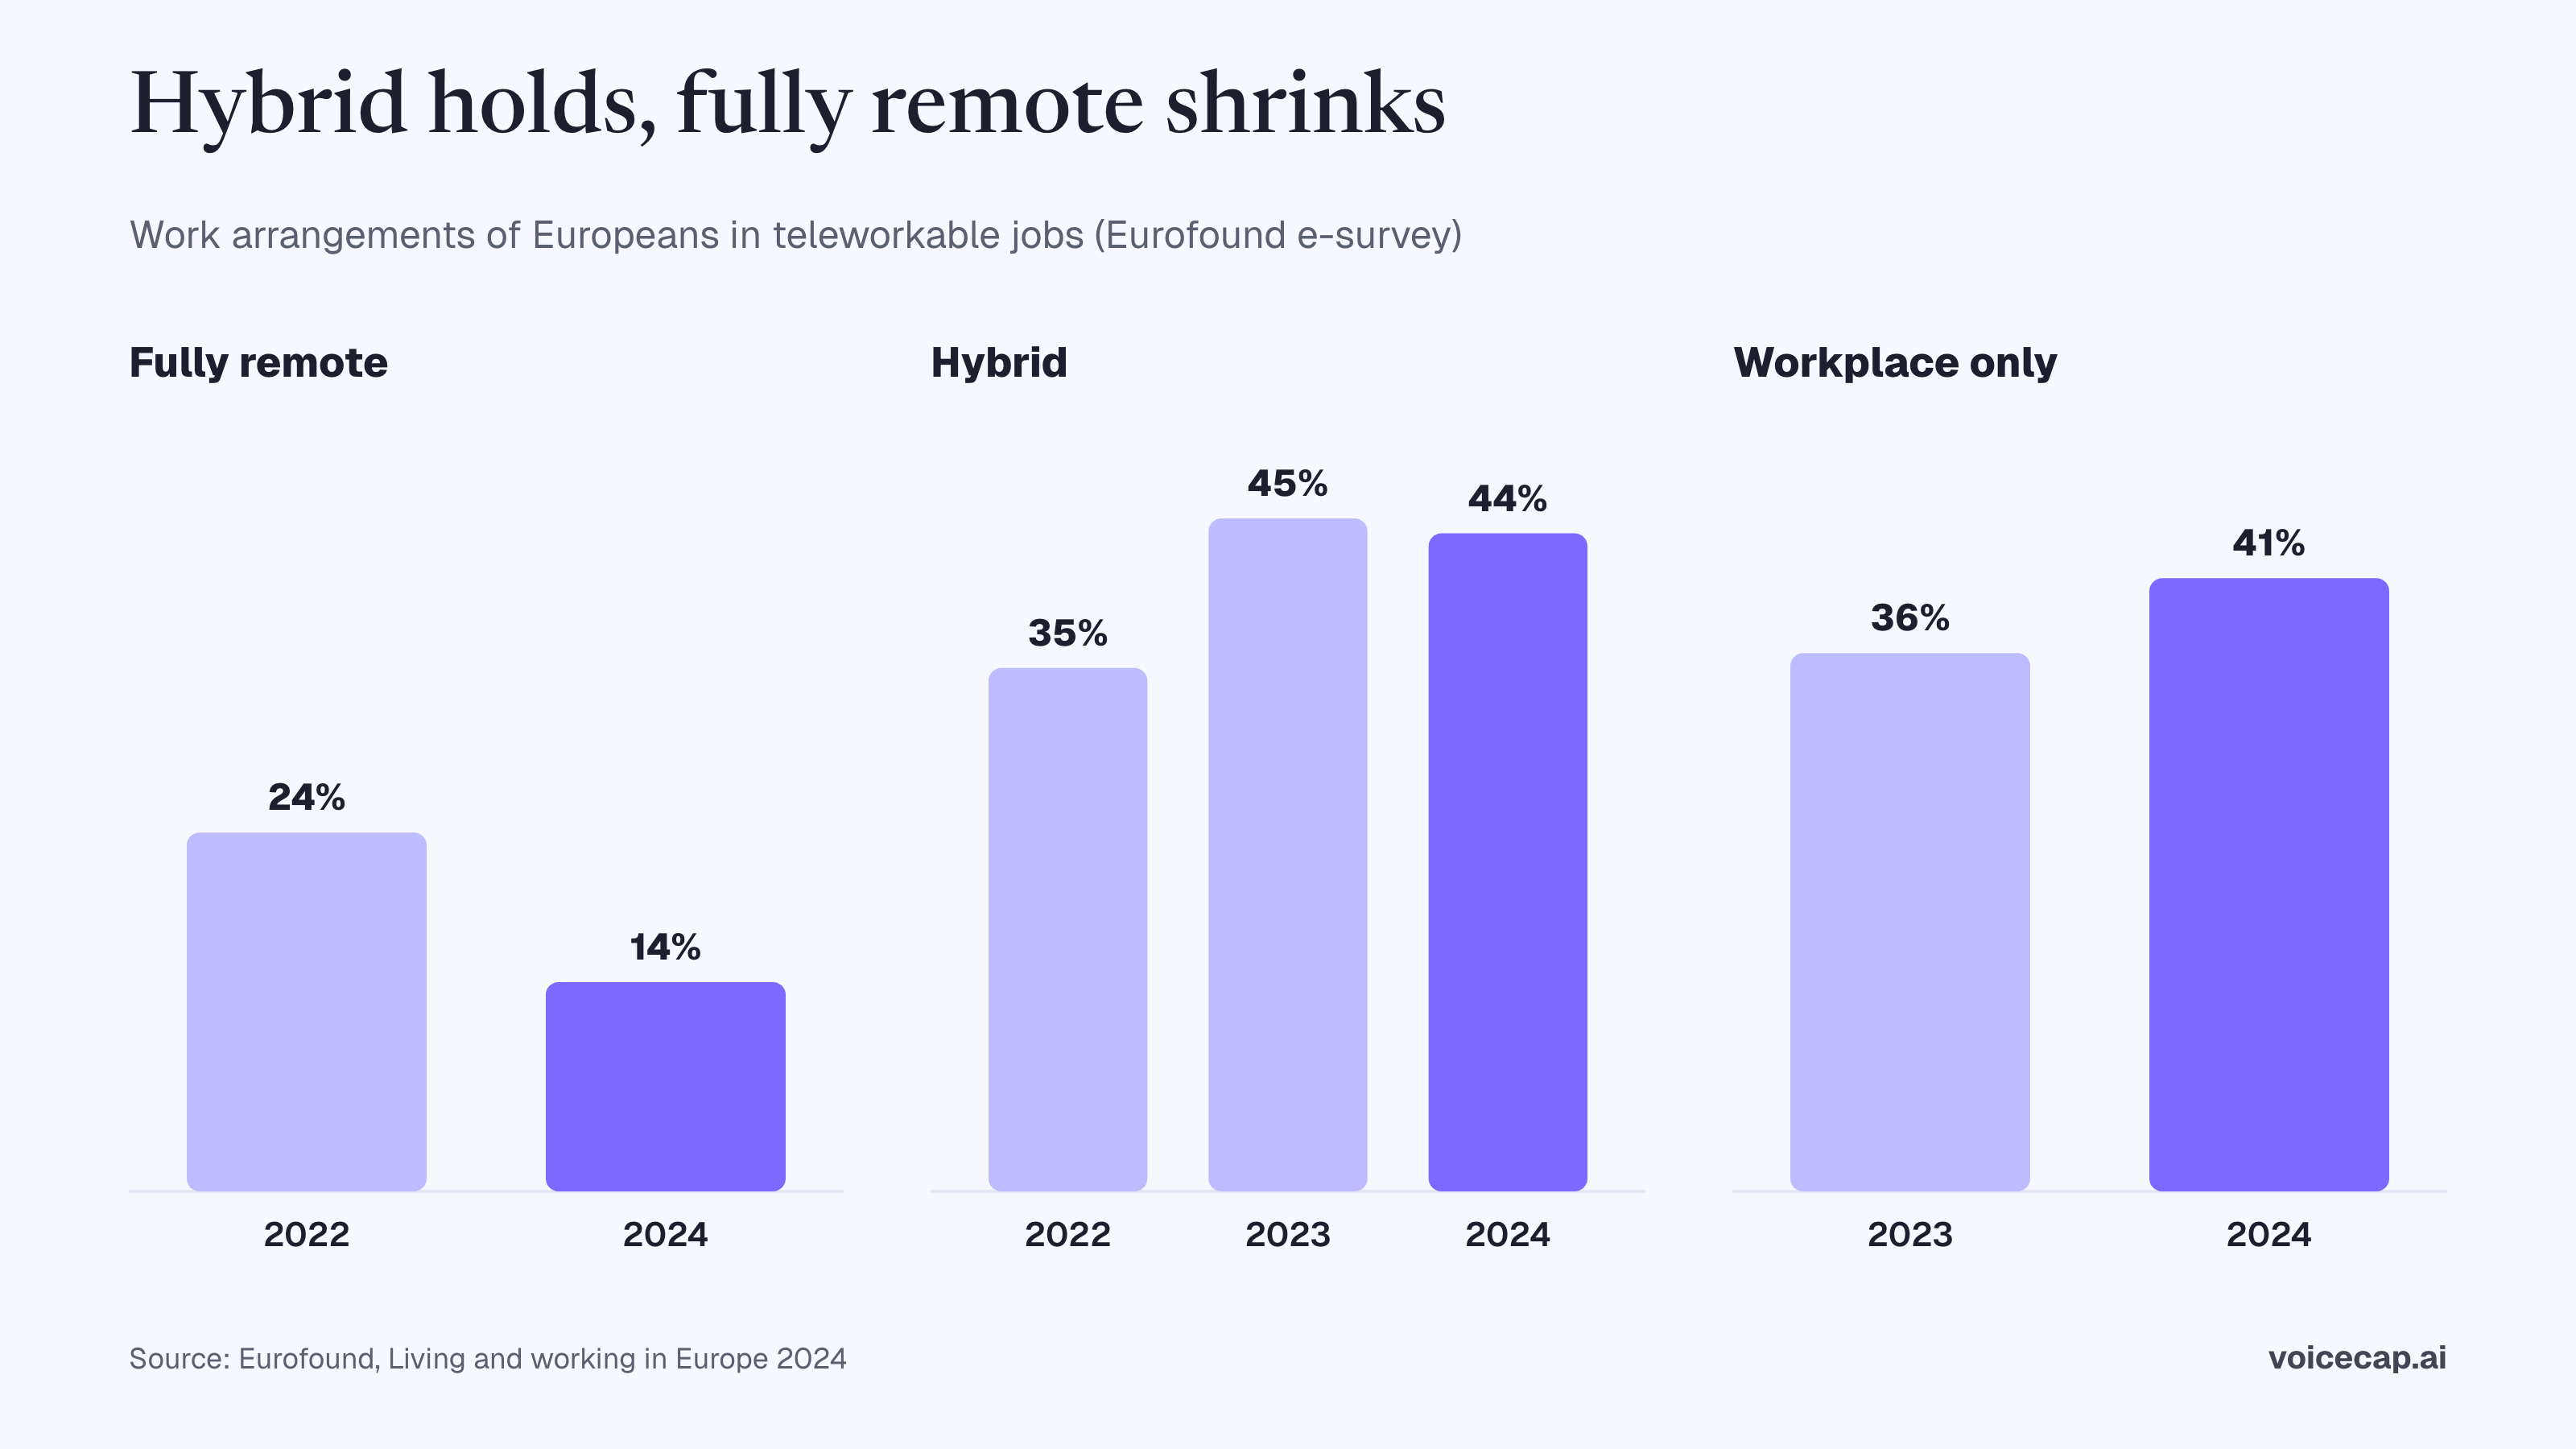
- Fully remote work fell from 24% in 2022 to 14% in 2024 among Eurofound e-survey respondents in teleworkable jobs, while workplace-only arrangements rose from 36% in 2023 to 41% in 2024 (Eurofound, Living and working in Europe 2024).
- Hybrid arrangements rose from 35% in 2022 to 45% in 2023 and eased to 44% in 2024 in the same survey (Eurofound, 2024).
- Over 50% of respondents wanted to work from home multiple times a week in 2024: 56% of women and 54% of men (Eurofound, 2024).
- 3% of EU-27 employees telework full time, 9% telework regularly and about 16% occasionally; total prevalence is 28% for women and 27% for men; by occupation, 60% of managers and 57% of professionals telework (Eurofound, EWCS 2024 first findings).
- Establishments reporting employees working from home nearly doubled from 13% in 2019 to 23% in 2024 across 30 countries (EU-OSHA, ESENER 2024, 41,458 establishments).
- UK workers split 51% fully in-office, 45% hybrid and 4% fully remote in July 2025 (Owl Labs, vendor survey, 2,000 UK workers).
- 64% of German workers worked hybrid in July 2024, up 13 percentage points from 51% in 2023, and 6% fully remote (Owl Labs, vendor survey, 2,000 German workers).
- 49% of French workers worked hybrid in July 2024, up from 47% in 2023, with 50% fully in-office and 1% fully remote (Owl Labs, vendor survey, 2,000 French workers).
How many meetings happen online rather than in person?
Just over half of EU enterprises now meet remotely, and in Germany online or hybrid meetings have overtaken in-person ones.
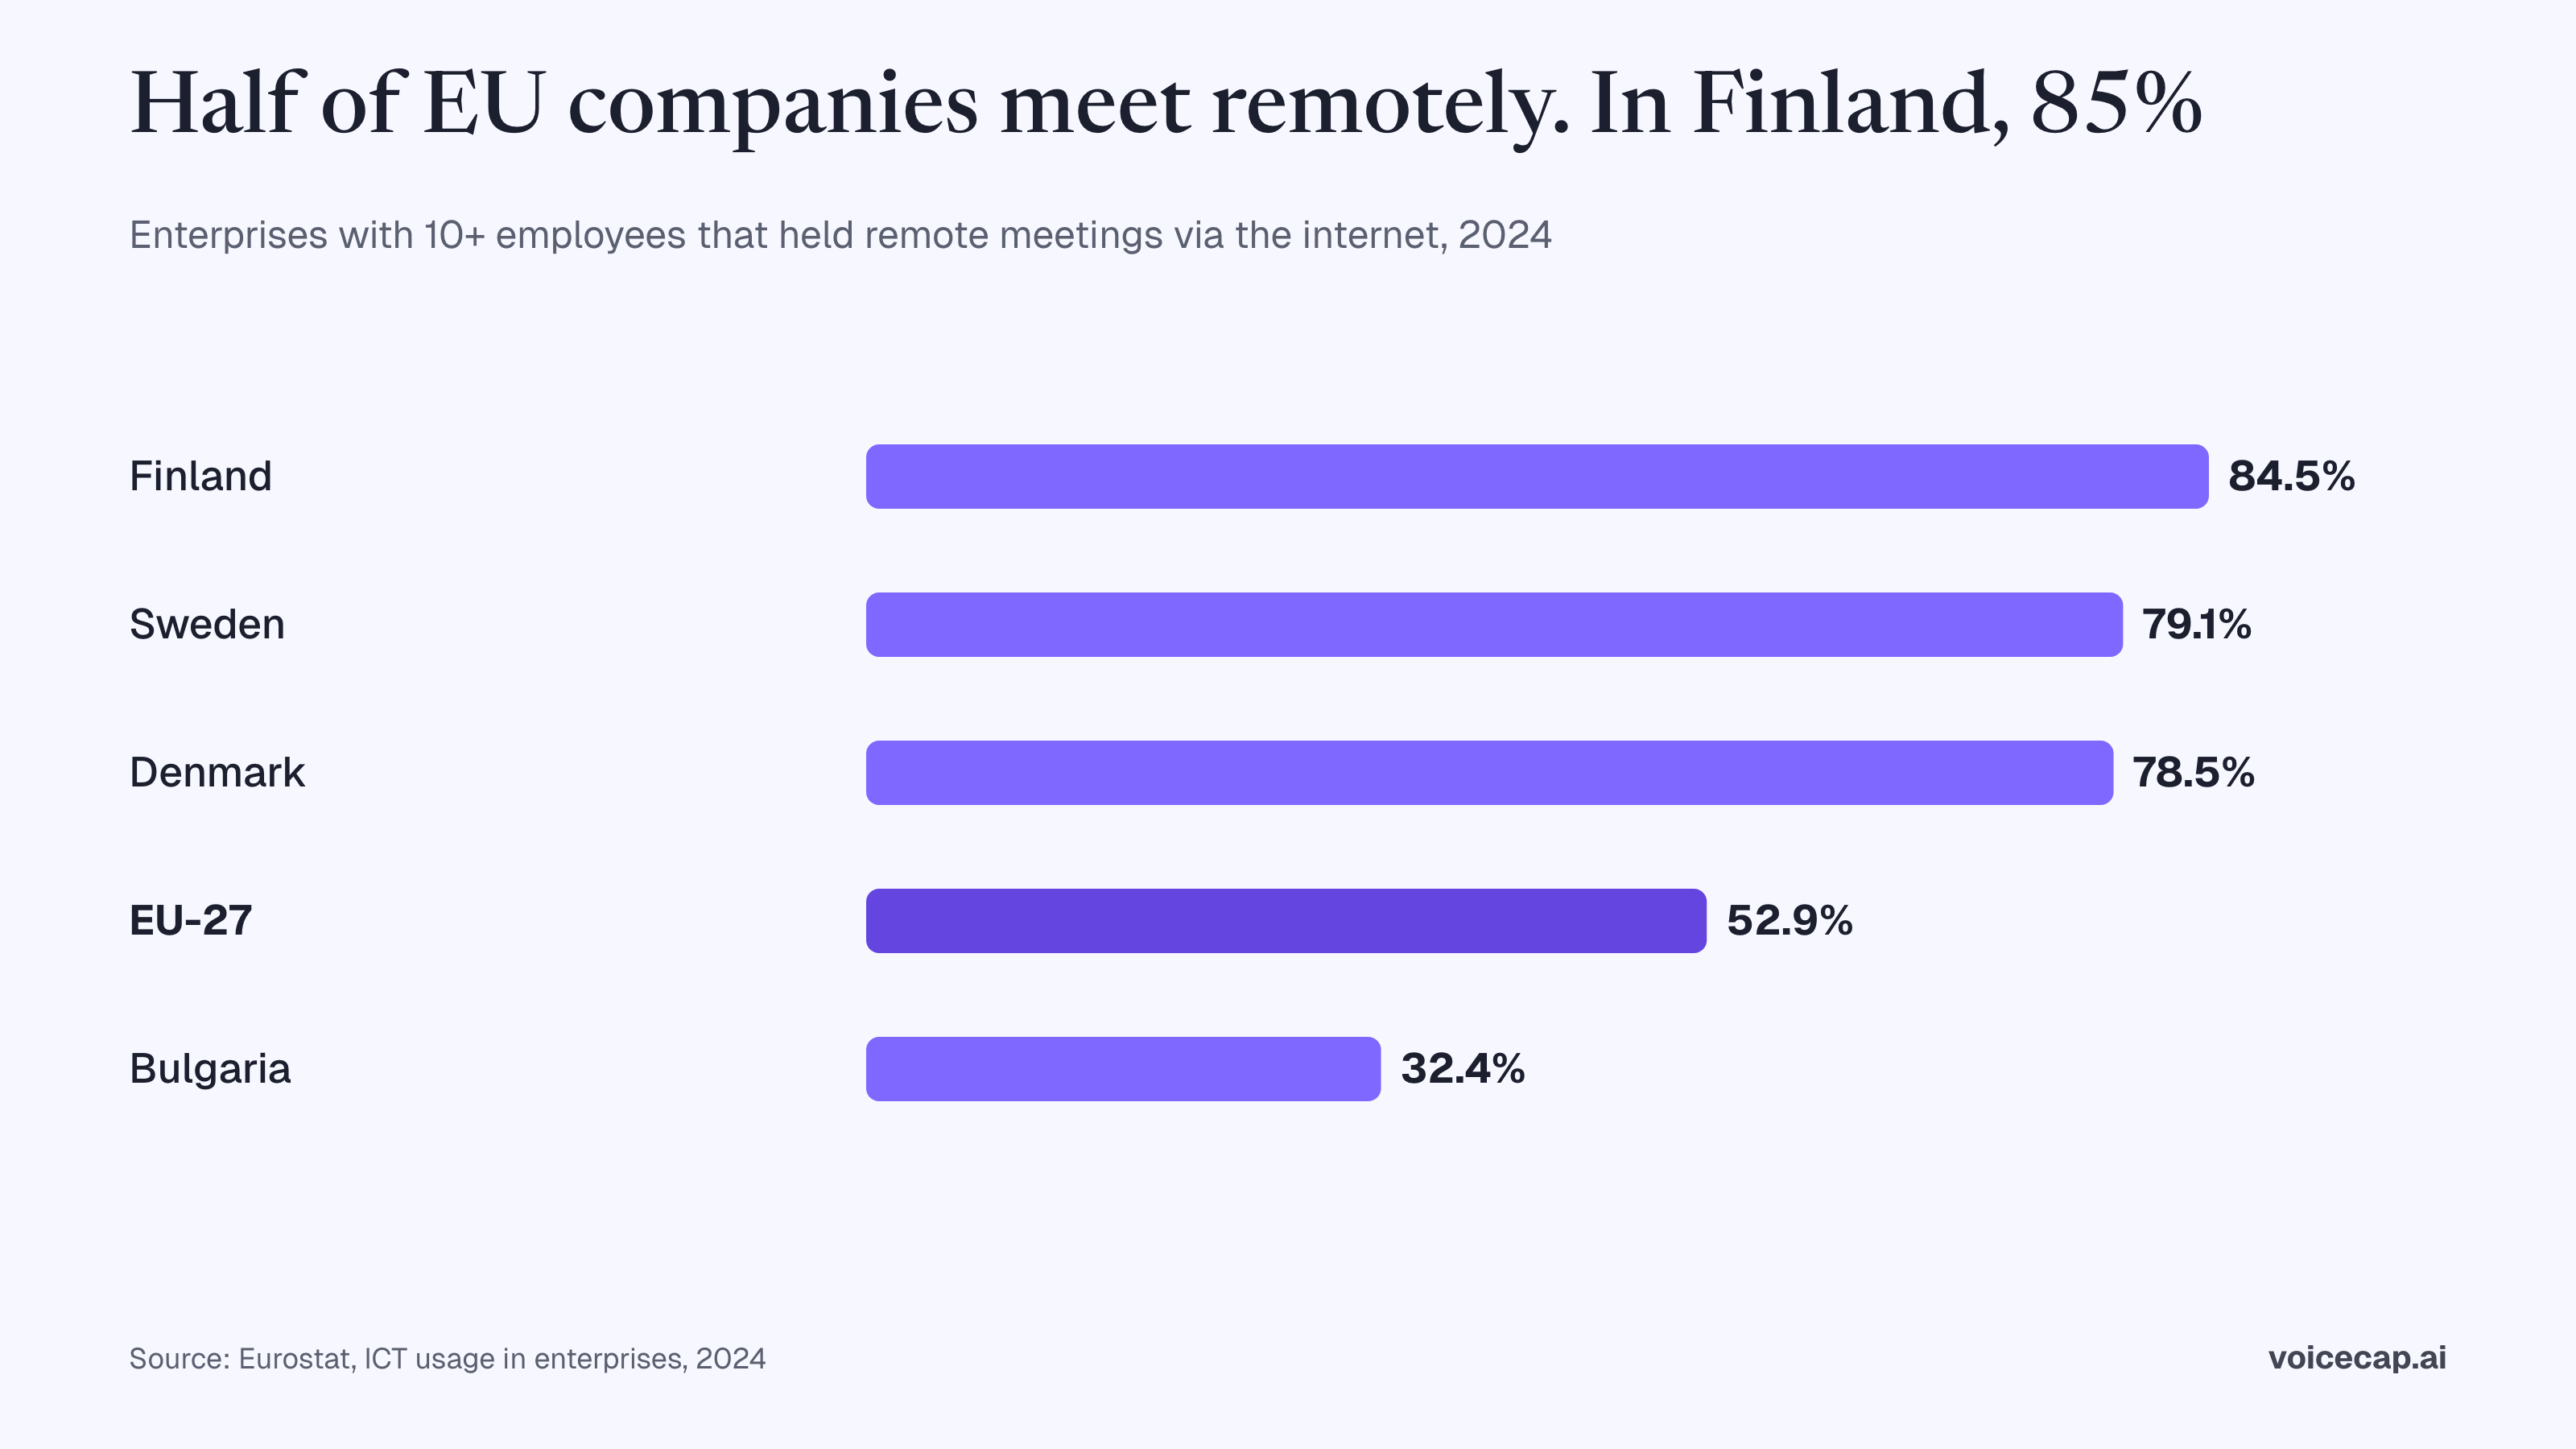
- 52.9% of EU enterprises with 10 or more employees conducted meetings remotely via the internet in 2024 (Eurostat, ICT usage in enterprises, May 2025).
- Finland led at 84.5%, followed by Sweden (79.1%) and Denmark (78.5%); Bulgaria was lowest at 32.4% (Eurostat, 2024).
- More German workers now have online or hybrid meetings (85%) than in-person meetings (84%) (Owl Labs, vendor survey, Germany, July 2024).
- French workers have nearly as many online or hybrid meetings (72%) as in-person meetings (78%) each week (Owl Labs, vendor survey, France, July 2024).
- UK workers average 5 online and 4 face-to-face meetings a week, lose 7 minutes on average getting hybrid meetings started, and 30% lose 10 or more minutes per meeting (Owl Labs, vendor survey, UK, July 2025).
- Employees in Germany who must be reachable by video call made eight such calls a day on average (Bitkom, 1,003 respondents, January 2021; older).
How has meeting load changed since 2019?
Meeting counts and total meeting time rose sharply from 2020 to 2023 in product telemetry, while individual meetings got shorter.
- Time spent in Microsoft Teams meetings had more than doubled (2.5x) globally by early 2021, the average meeting grew 10 minutes longer, from 35 to 45 minutes, and 62% of calls and meetings were unscheduled or ad hoc (Microsoft Work Trend Index, telemetry plus 31,092 workers in 31 markets, March 2021).
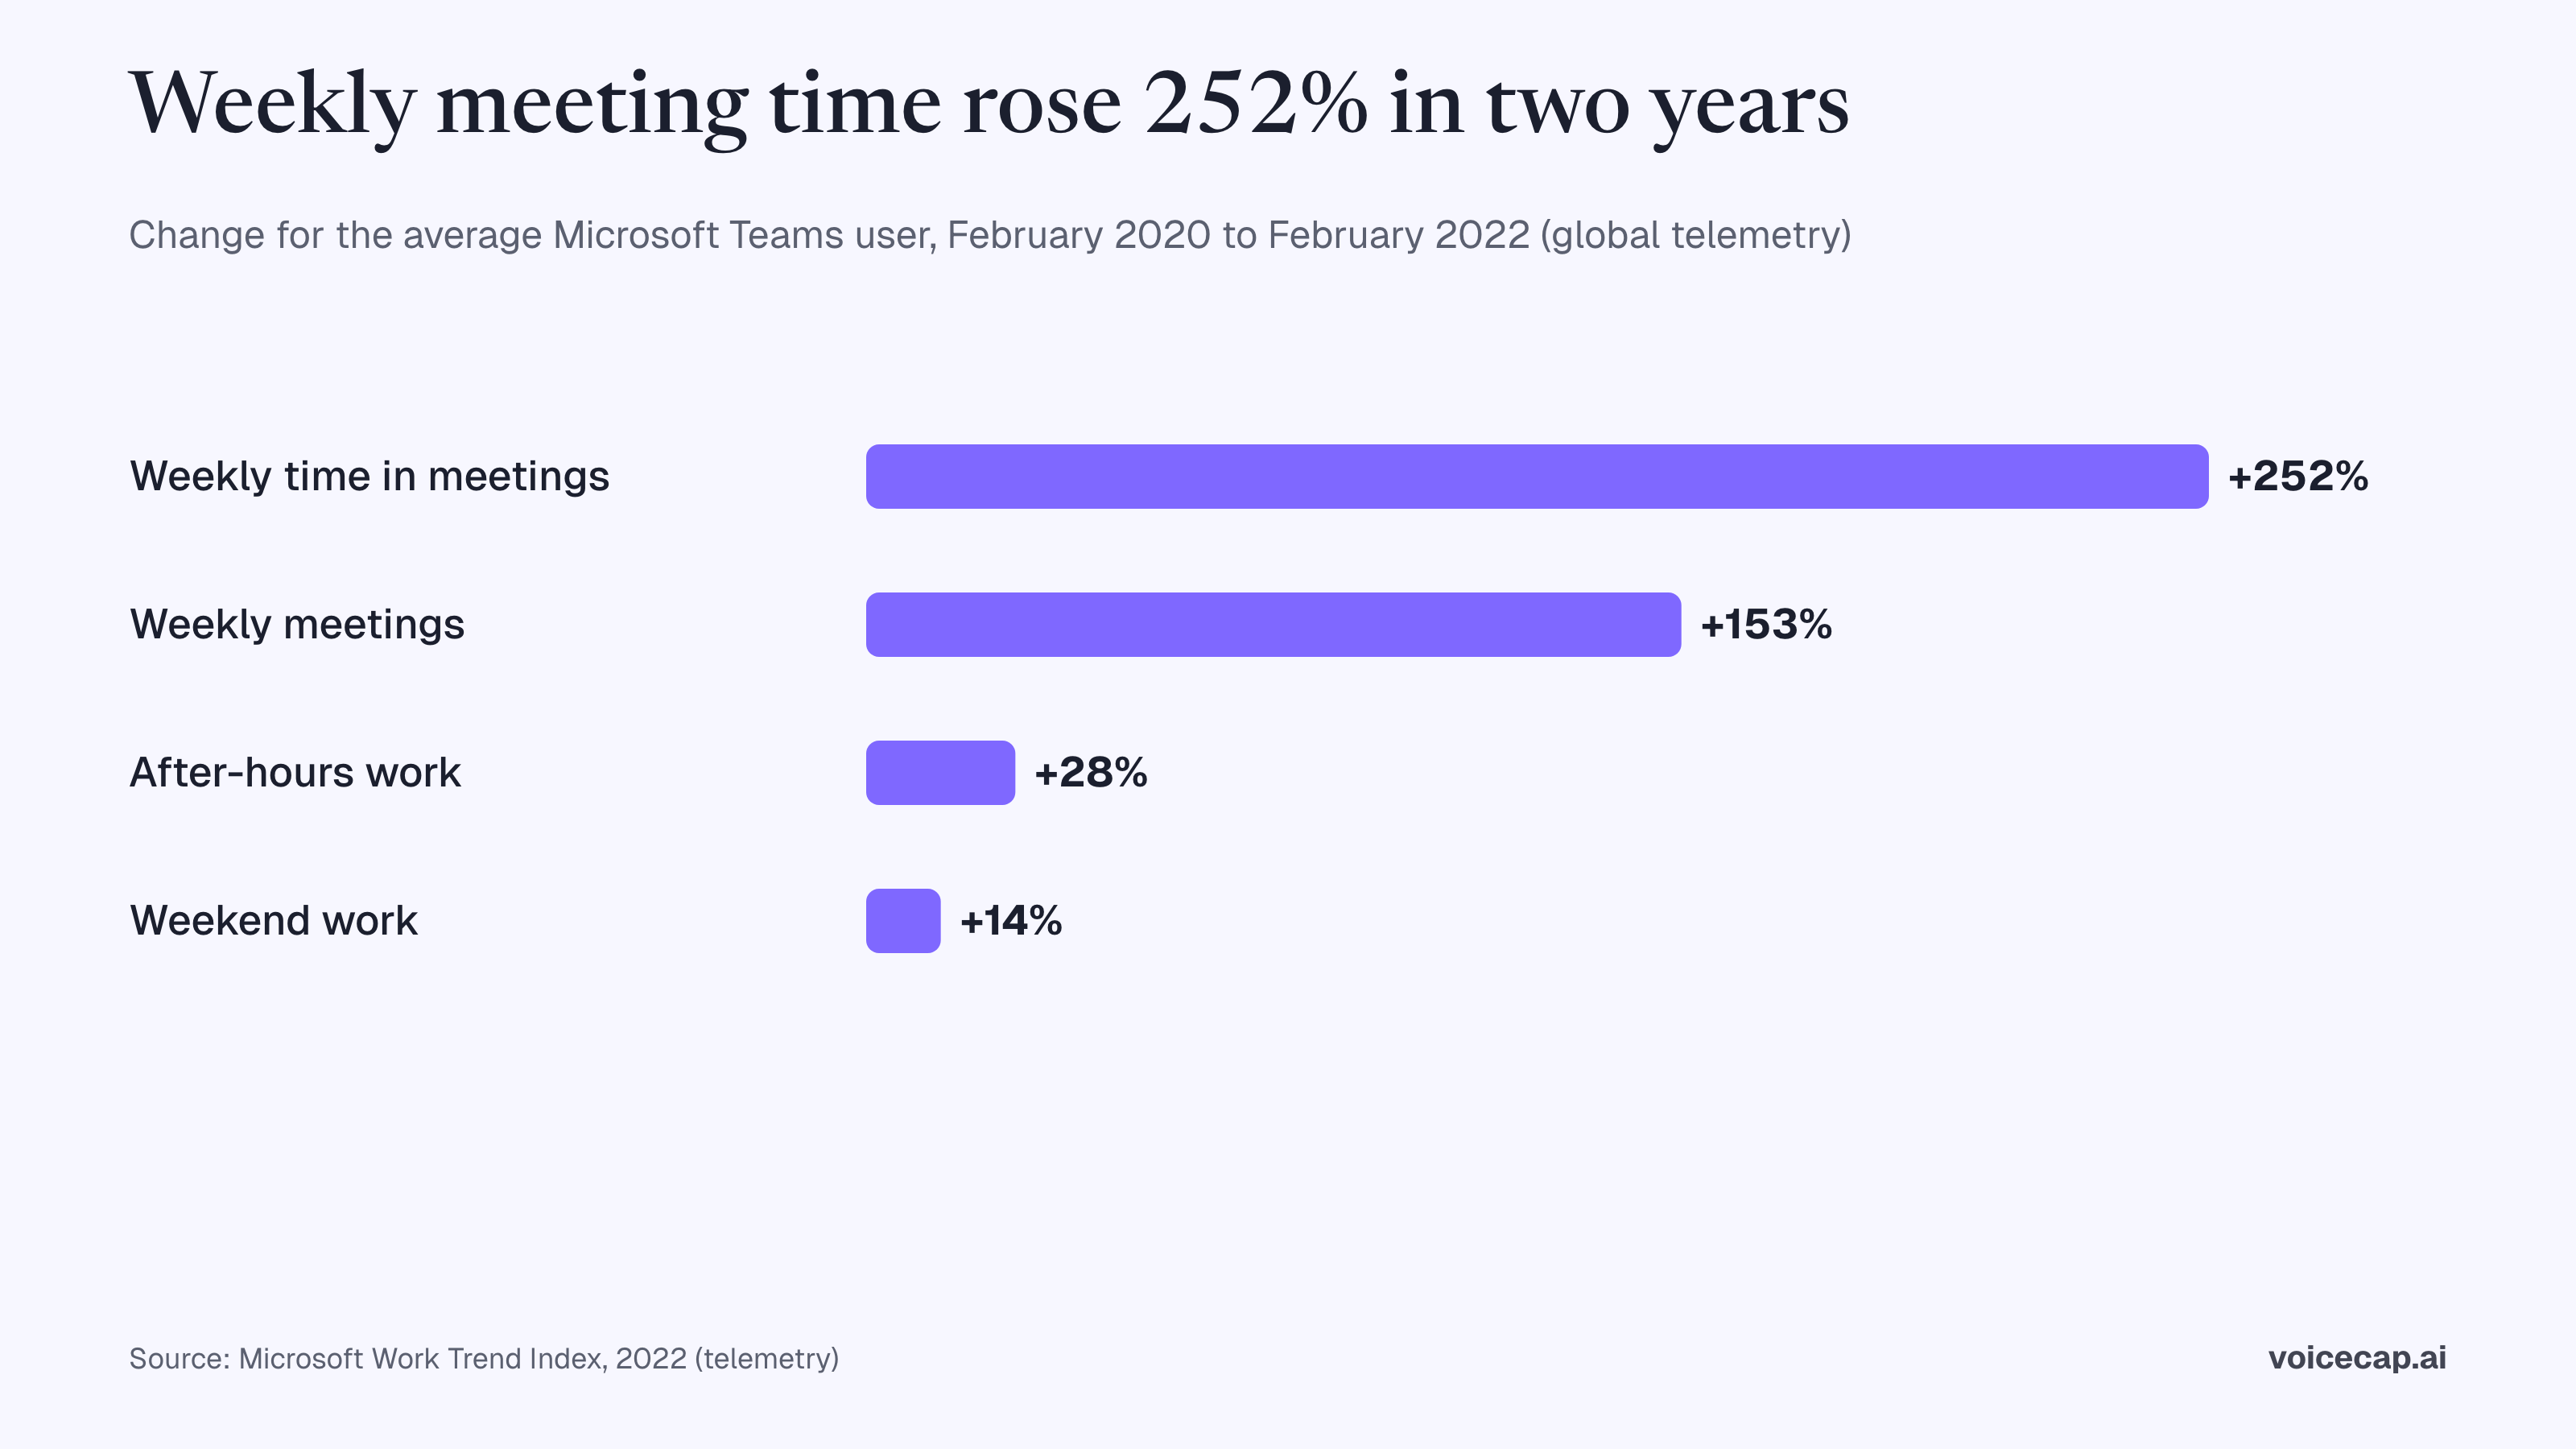
- By February 2022 the average Teams user's weekly meeting time was up 252% since February 2020, weekly meetings were up 153%, overlapping meetings per person per month were down 44%, after-hours work was up 28% and weekend work 14%; ad hoc calls made up 64% of Teams meetings and meetings under 15 minutes were 60% of all meetings (Microsoft Work Trend Index, telemetry plus 31,102 workers in 31 markets, March 2022).
- By March 2023 people were in 3x more Teams meetings and calls per week than in February 2020, a 192% increase, and the heaviest 25% of users spent 7.5 hours a week in meetings (Microsoft Work Trend Index, telemetry, May 2023).
- 57% of meetings are ad hoc calls without a calendar invite, 1 in 10 scheduled meetings are booked at the last minute, meetings after 8 pm are up 16% year on year, 50% of meetings fall between 9–11 am and 1–3 pm, Tuesdays carry 23% of the week's meetings against 16% on Fridays, and 30% of meetings span multiple time zones, up 8 points since 2021 (Microsoft Work Trend Index, telemetry, June 2025).
- Employees are interrupted every two minutes during core hours, 275 times a day, by meetings, emails or chats (Microsoft Work Trend Index, telemetry, June 2025).
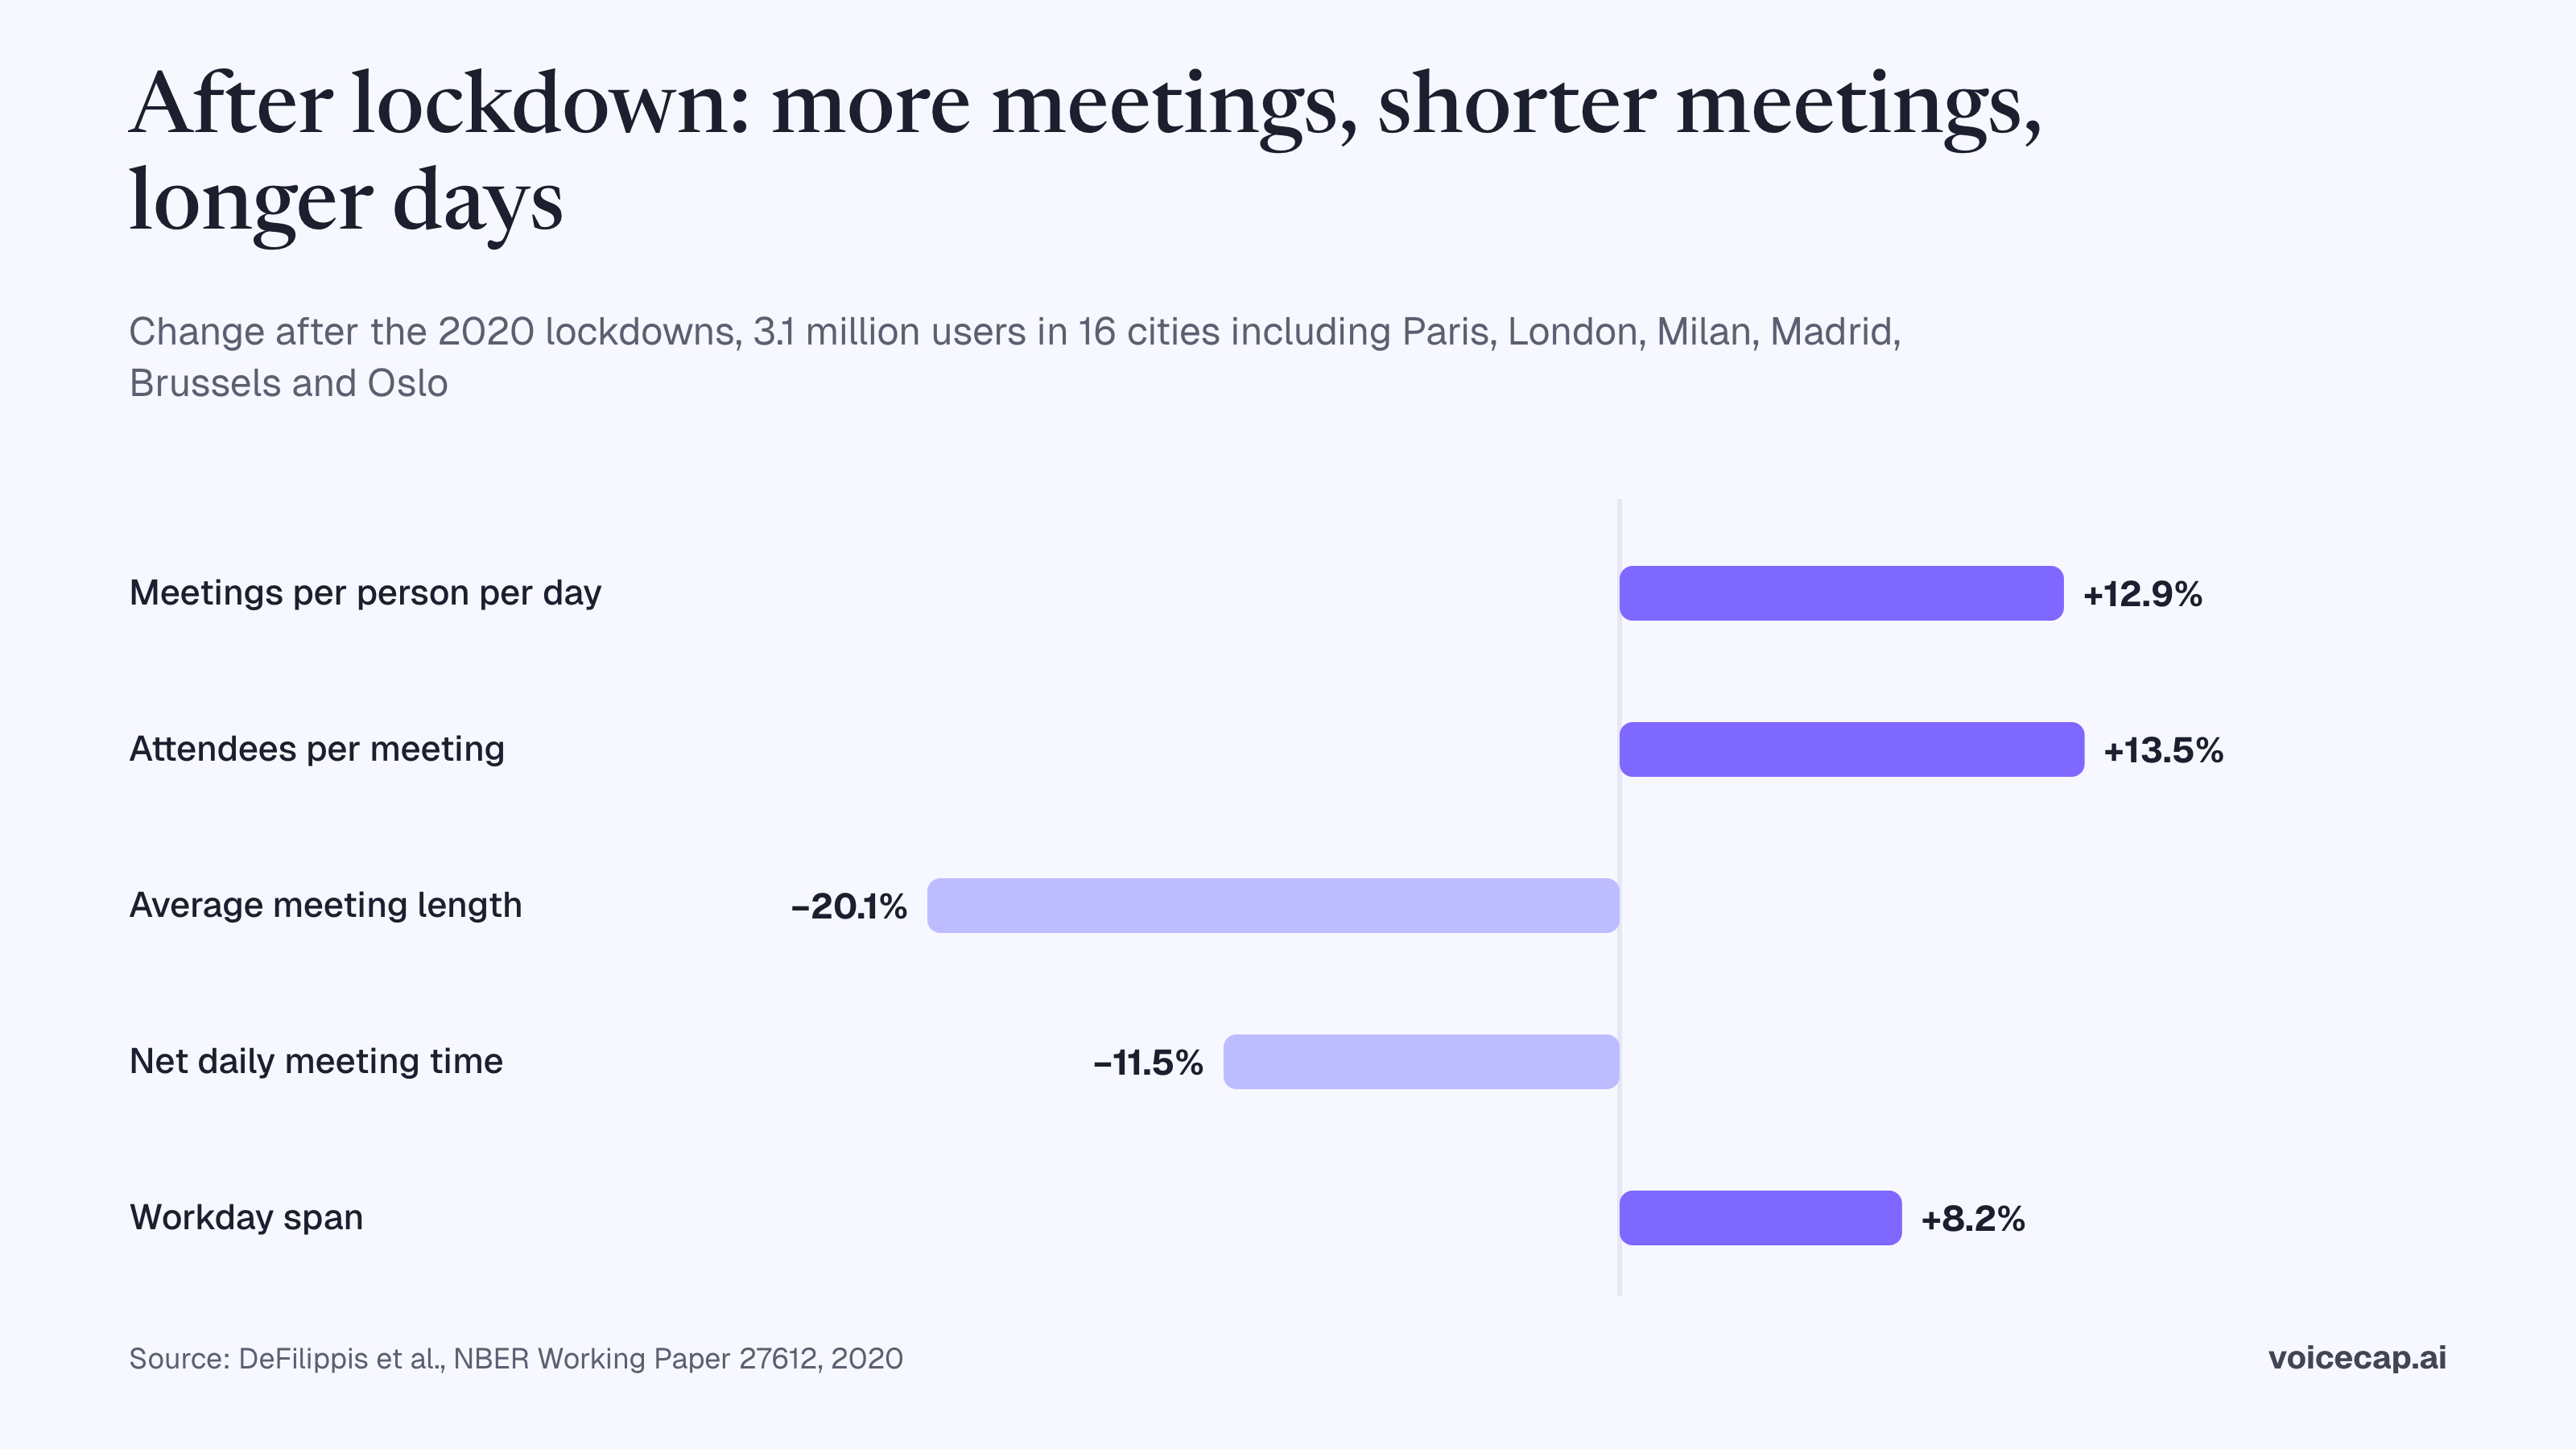
- Across 3,143,270 users in 21,478 firms in 16 metropolitan areas, nine of them European (Milan, Rome, Oslo, Madrid, Zurich, Geneva, Paris, Brussels, London), lockdowns raised meetings per person per day by 12.9% (+0.8 meetings) and attendees per meeting by 13.5% (+2.1), cut average meeting length by 20.1% (−12.1 minutes), and reduced net daily meeting time by 11.5% (−18.6 minutes) while the workday span grew 48.5 minutes (+8.2%) (DeFilippis, Impink, Singell, Polzer and Sadun, NBER Working Paper 27612, 2020).
- At Microsoft, firm-wide remote work cut total meeting and call hours by 5% of the pre-pandemic level and cut the share of collaboration time spent with cross-group connections by about 25% (Yang et al., Nature Human Behaviour, 2022; US employees).
- At one large Asian IT services firm, working from home raised total hours worked by roughly 30%, after-hours work by 18%, weekly hours in meetings and calls by 0.7 to 1.25 hours, and stretched the measured workday from 7.64 to 9.17 hours, while productivity fell by about 20% (Gibbs, Mengel and Siemroth, IZA Discussion Paper 14336, 2021).
The 2020 event study is the only source in this set with named European cities and confidence intervals; the Microsoft series is global telemetry and should be cited as such.
How many hours a week do people spend in meetings, by role?
Senior people meet the most: executives report close to 23 hours a week, against roughly six hours for the average employee in the peer-reviewed literature.
- Executives spend an average of nearly 23 hours a week in meetings, up from less than 10 hours in the 1960s (Perlow, Hadley and Eun, "Stop the Meeting Madness", Harvard Business Review, July–August 2017; survey of nearly 200 senior executives).
- Employees spend an average of six hours per week in scheduled meetings, a conservative estimate, with employees of larger organisations attending more (Rogelberg, Allen, Shanock, Scott and Shuffler, Human Resource Management, 2010; US).
- In companies with fewer than 10 people managers spent at least 10% of their time preparing and running meetings; in organisations of 500 or more, around 75% (Van Vree 1999, as cited in Rogelberg et al. 2010; older).
- 55% of executives and 27% of all desk workers say they spend too much time in meetings; people who say so are more than twice as likely to say they lack time to focus, and once meetings take up more than two hours a day a majority of desk workers feel overburdened (Slack Workforce Index, 10,333 workers in the US, Australia, France, Germany, Japan and the UK, fieldwork 24 August–15 September 2023).
- Professionals attended an average of 3 meetings a week lasting an average of 1 hour each (Doodle, 6,026 professionals in the UK, Germany and the US, 2019; older).
No European statistical office or ministry measures hours in meetings directly; see Gaps.
How much meeting time is unproductive?
Between half and three quarters of meeting time is rated wasted or ineffective in every survey that asks, and inefficient meetings top the list of productivity disruptors.
- Only 17% of senior executives said their meetings are generally productive uses of group and individual time, and 54% rated them wasters of both individual and group time (Perlow, Hadley and Eun, HBR, 2017; full text paywalled).
- Meetings are ineffective 72% of the time; 78% of people say they are expected to attend so many meetings it is hard to get work done; 76% feel drained on heavy-meeting days; 80% say they would be more productive with fewer meetings; 51% work overtime at least a few days a week because of meeting overload (Atlassian, "Workplace Woes: Meetings", 5,000 knowledge workers across four continents, 2024; vendor survey).
- In organisations with poor meeting cultures, people spend 50% more time in unnecessary meetings than making progress on high-priority work (Atlassian, State of Teams 2024, 5,000 knowledge workers and 100 Fortune 500 executives; vendor survey).
- Inefficient meetings ranked as the number one productivity disruptor and too many meetings number three; 68% of people lack enough uninterrupted focus time and 64% struggle to find the time and energy to do their job (Microsoft Work Trend Index, 31,000 workers in 31 markets, 1 February–14 March 2023).
- 42% of meeting participants multitask during meetings by actively sending an email or chat in an average week (Microsoft Work Trend Index, 20,006 knowledge workers in 11 countries, July–August 2022).
- Two-thirds of meetings attended were deemed unnecessary, and 37% of professionals considered unnecessary meetings the biggest cost to their organisation (Doodle, 2019; older).
What does a meeting cost in Europe?
No statistical office publishes a cost-of-meetings figure. The verified inputs are hourly labour costs and annual earnings by occupation; the two calculations at the end are ours.
- Average hourly labour costs in the whole economy were €34.9 in the EU and €38.2 in the euro area in 2025 (Eurostat, March 2026).
- Hourly labour costs ranged from €12.0 in Bulgaria to €56.8 in Luxembourg, with Denmark at €51.7 and the Netherlands at €47.9 (Eurostat, 2025).
- Germany €45.0, Sweden €43.1, Estonia €21.1, Lithuania €17.8, Latvia €16.3 (Eurostat, lc_lci_lev, 2025).
- Mean annual gross earnings in enterprises with 10 or more employees, 2022: managers earned €111,275 in Germany, €91,736 in the Netherlands, €34,264 in Lithuania and €31,339 in Poland; professionals earned €72,211, €67,324, €29,572 and €20,894 respectively (Eurostat, Structure of Earnings Survey earn_ses22_28, published 2026).
- Actual weekly hours in the main job averaged 36.0 in the EU in 2024, down from 37.0 in 2014; the Netherlands had the shortest week at 32.1 hours and Greece the longest at 39.8 (Eurostat, May 2025).
- Annual hours actually worked per worker averaged 1,736 across the OECD in 2025, with Germany lowest among the countries checked at 1,332 and Lithuania at 1,673 (OECD, 2025).
- Wages in public administration are lower than in the rest of the economy in most Member States after controlling for other factors, with the widest gaps in Germany (−28%) and Bulgaria (−18%); health-sector wages are lower in 15 of 27 Member States, with the widest gap in Greece (−16%) (Eurostat, Wage determinants in the EU, SES 2022, published 2025).
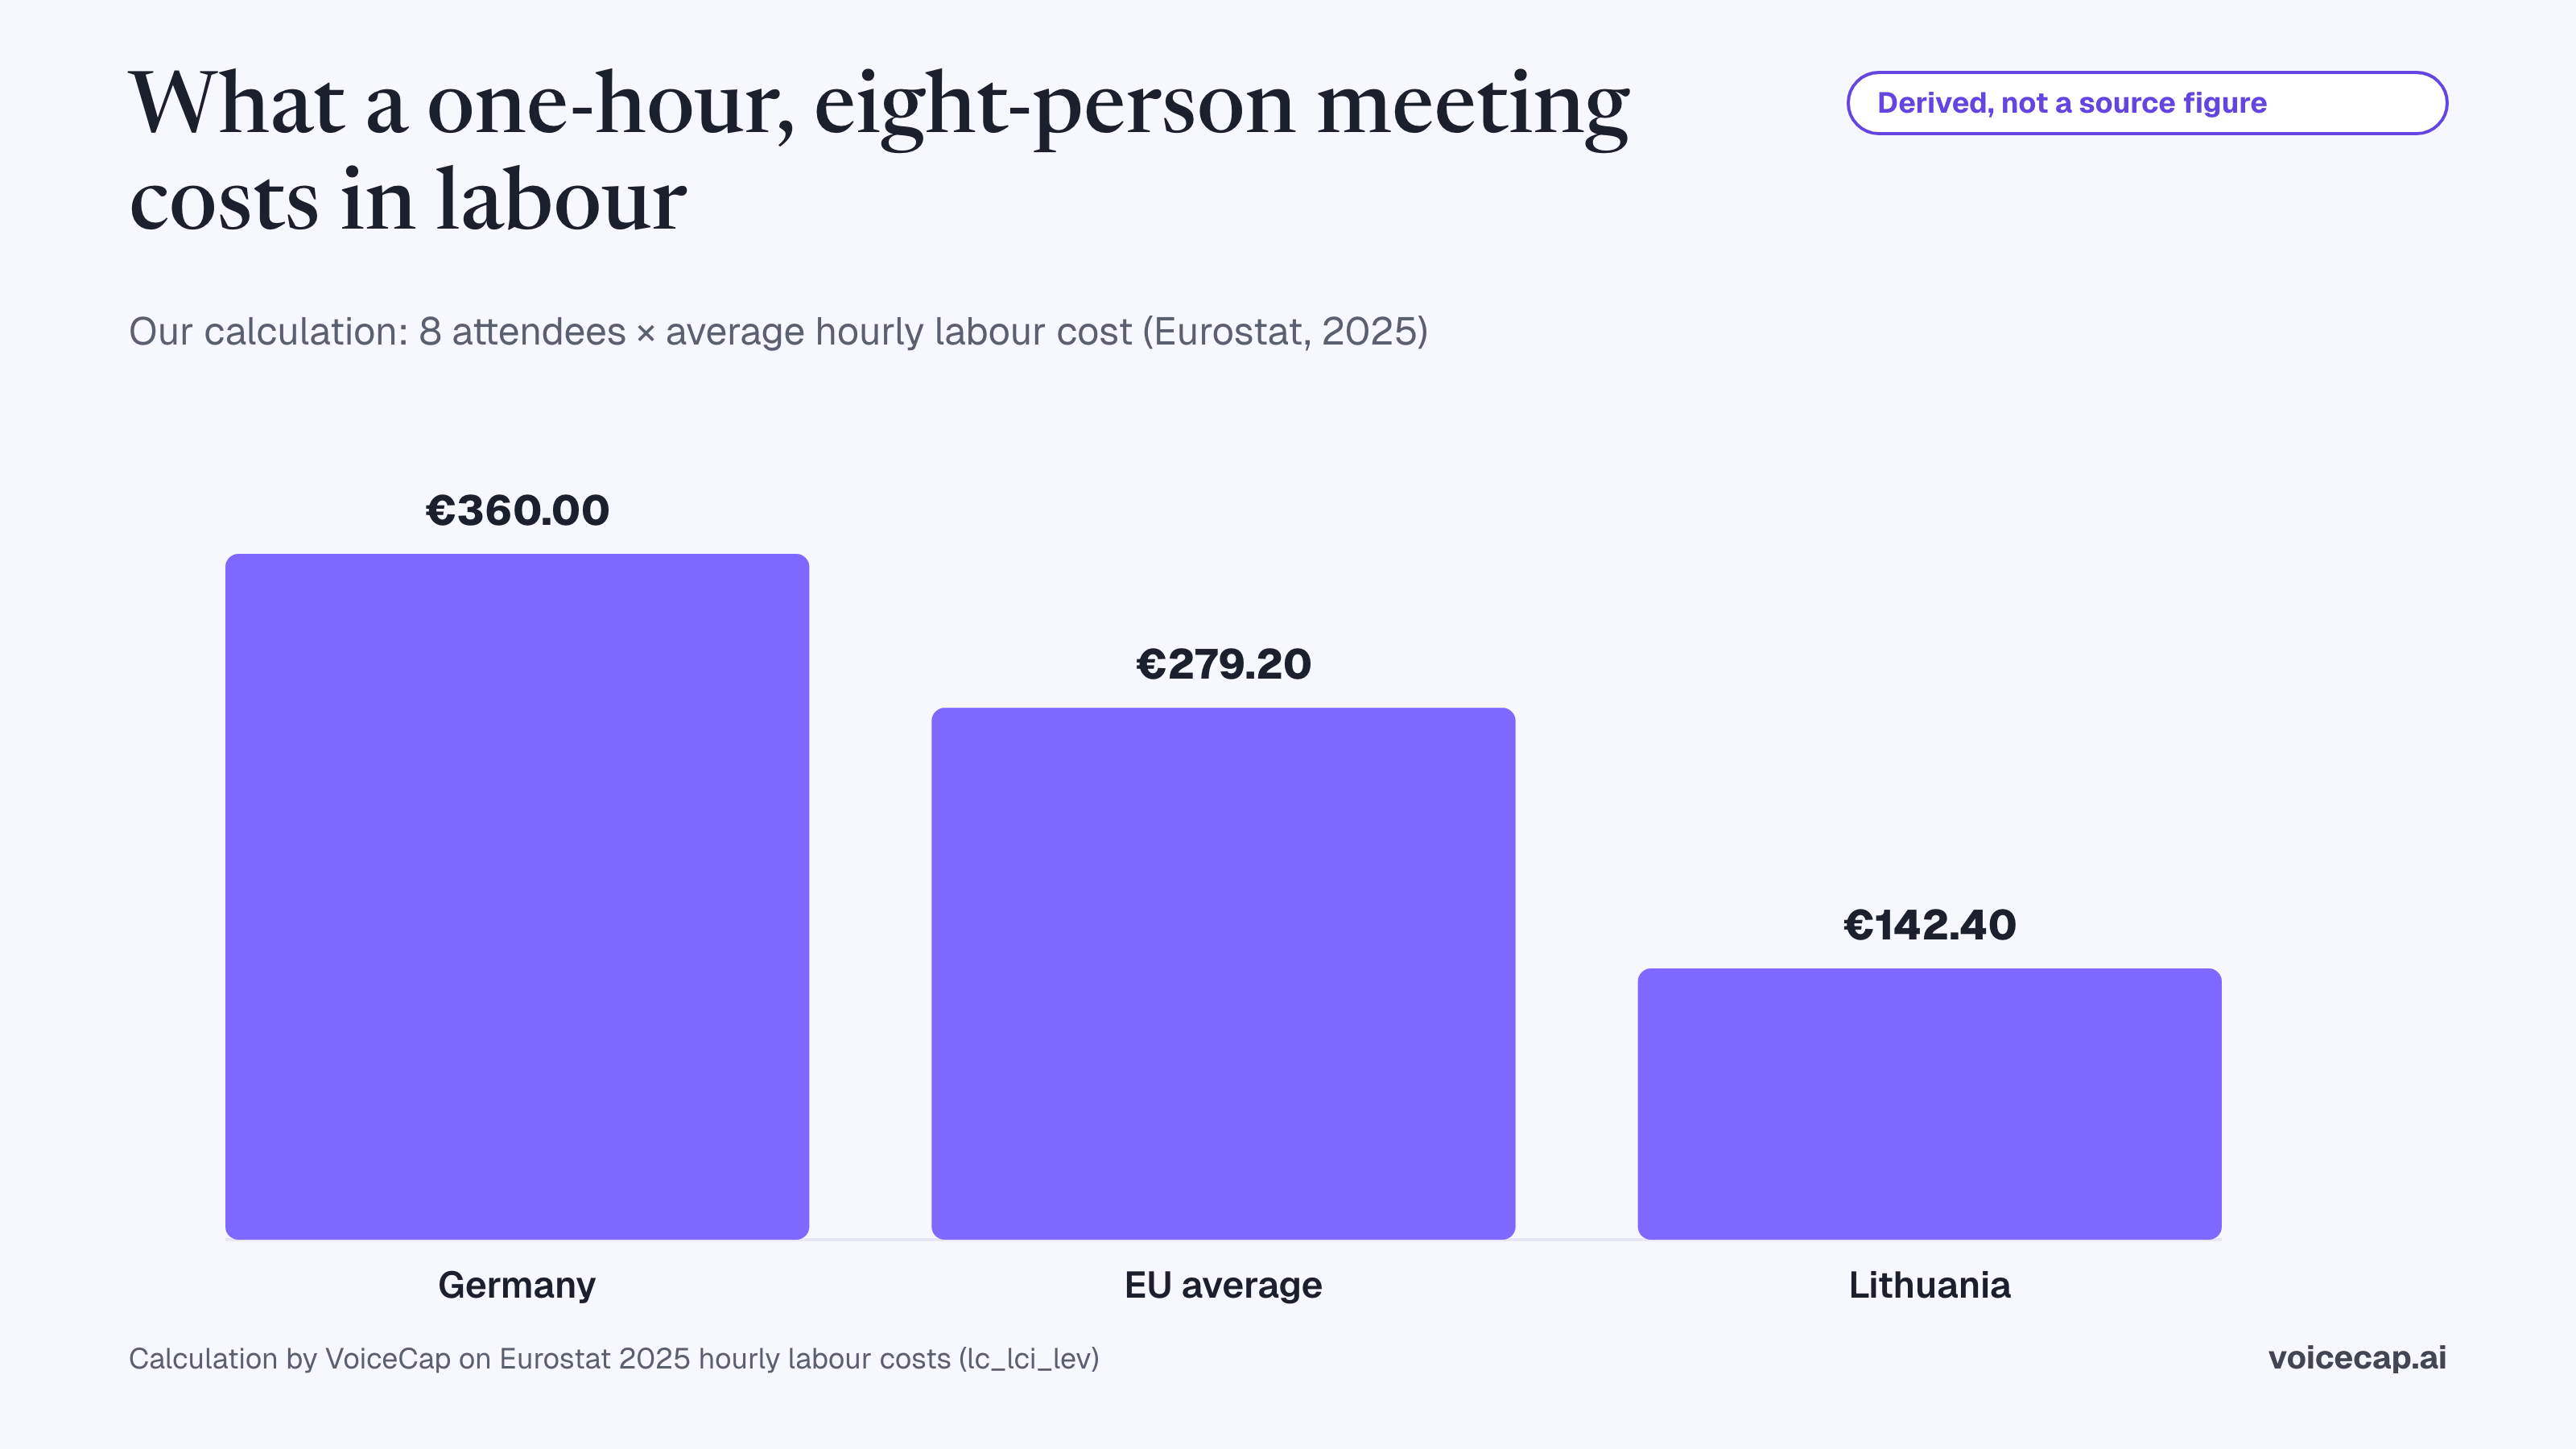
Derived, not a source figure. A one-hour meeting with eight attendees costs 8 × €34.9 = €279.20 in employer labour cost at the EU average, 8 × €45.0 = €360.00 in Germany and 8 × €17.8 = €142.40 in Lithuania. A worker in scheduled meetings six hours a week for 46 working weeks consumes 6 × 46 × €34.9 = €9,632.40 of labour cost a year at the EU average. These are arithmetic on the Eurostat inputs above and the Rogelberg et al. six-hour estimate; they are not published statistics and should be cited as this page's calculation.
How often do meetings end without decisions or follow-through?
More than half of workers regularly leave meetings without clear next steps, and no peer-reviewed study measures action-item completion rates.
- 54% of workers frequently leave meetings without a clear idea of next steps or who owns which task, and 77% are frequently in meetings that end in a decision to schedule a follow-up meeting (Atlassian, 5,000 knowledge workers, 2024; vendor survey).
- 62% of workers say they struggle with too much time spent searching for information in their workday (Microsoft Work Trend Index, 31,000 workers, 2023).
- Only 46% of US employees strongly agree they know what is expected of them at work, down from 56% in March 2020 (Gallup, 79,087 employed US adults, 2024; US only, no European equivalent found).
How large and how long is an average meeting?
The only telemetry with a confidence interval puts the post-lockdown average at about 48 minutes, while product data shows a majority of Teams meetings under 15 minutes.
- Average meeting length in the 16-city event study fell from about 60 minutes before lockdowns to about 48 minutes after, and average attendees per meeting rose from 15.6 to 17.7 (DeFilippis et al., NBER 27612, Appendix Table S1, 2020; city-day aggregates weighted across all meetings, so large recurring meetings pull the mean up).
- The 35-to-45-minute average and the 60% share of meetings under 15 minutes cited in the load-trend section above are the Microsoft telemetry equivalents (Microsoft Work Trend Index, 2021 and 2022).
- The Doodle 2019 average of one hour per meeting and Owl Labs' five online plus four face-to-face meetings a week for UK workers are the survey-based equivalents (see the sections above).
Which sectors meet and telework the most?
Financial services has the highest telework rate of any sector in Europe, and public-sector and health workers report the tightest time.
- 61% of workers in financial services telework at some frequency, ahead of education (49%) and other services (43%) (Eurofound, EWCS 2024 first findings).
- 81% of investment-management professionals said they would like to work remotely at least part of the time (CFA Institute, about 4,600 members in 120 markets, March–April 2021; global, older).
- Only 46.51% of NHS staff in England said they can meet all the conflicting demands on their time at work in the 2025 survey, against 47.20% in 2024 and 42.79% in 2022 (NHS England, NHS Staff Survey 2025, 766,285 respondents across 238 organisations).
- 43% of establishments across 30 European countries report time pressure as a psychosocial risk factor (EU-OSHA, ESENER 2024).
- Sector pay gaps that feed any cost calculation are in the cost section above (Eurostat SES 2022: public administration and health).
Legal and consulting have no primary-source meeting data; see Gaps.
What do European rules say about working time and being always on?
EU law caps average weekly working time at 48 hours and guarantees 11 hours of daily rest; a right-to-disconnect directive is under consultation and 13 Member States already legislate it.
- Average working time for each seven-day period, including overtime, must not exceed 48 hours, and every worker is entitled to a minimum daily rest of 11 consecutive hours per 24-hour period (Directive 2003/88/EC, Articles 6(b) and 3).
- 13 Member States have legislation on the right to disconnect: Belgium, Bulgaria, Croatia, Cyprus, Greece, France, Ireland, Italy, Luxembourg, Portugal, Slovakia, Slovenia and Spain (European Commission, C(2025) 7020, second-phase social-partner consultation, 25 July 2025). In June 2023 the count was nine (Eurofound, 2023).
- 44% of teleworkers worked overtime in 2021, 14 points more than on-site workers in occupations with some teleworkability; among full-time employees 21% of teleworkers worked 41–48 hours and 14% more than 48 hours, against 17% and 9% of on-premises workers (Eurofound EWCS 2021, cited in European Commission C(2025) 7020).
- 34% of teleworkers reported working more than their contracted hours without additional compensation, 5 points more than non-teleworkers; 59% of workers and 46% of employers named the right to disconnect a main area for improvement (European Commission 2022 exploratory study, cited in C(2025) 7020).
- In 2019, 14% of EU-27 employees were contacted several times outside working hours and 23% occasionally, with rates above 30% in Finland and Sweden (European Commission, C(2025) 7020; older baseline).
- Over 80% of workers surveyed in Belgium, France, Italy and Spain received work-related communications outside contractual hours in a typical week, and around 45% said a right-to-disconnect policy was in place at their company (Eurofound, Right to disconnect: implementation and impact at company level, 1,634 workers, 2023).
- The share of EU workers working 48 hours or more a week nearly halved from 20% in 2005 to 11% in 2024; working in free time to meet work demands fell from 31% in 2010 to 20% in 2024; 56% of workers were happy with their hours, while close to 70% of those working 41 hours or more wanted fewer hours (Eurofound, Trends in job quality: EWCS 2024).
- 46% of EU workers said they are exposed to severe time pressure or work overload, 52% said digital technologies determine the pace of their work and 33% said those technologies increase their workload (EU-OSHA, OSH Pulse 2022, 25,683 EU-27 workers).
What no primary source measures
Some of the most quoted meeting numbers have no primary source behind them. Each gap below was searched in English and, where relevant, German, French, Swedish, Finnish, Lithuanian, Latvian and Estonian.
- Hours per week in meetings, measured by a European statistical office. No labour force survey or time-use survey publishes "time in meetings" as a category. The only European numbers are vendor surveys (Owl Labs, Doodle, Slack) and Microsoft telemetry.
- Meetings per week by role, for Europe. ONS gives hybrid rates by occupation and the EWCS gives telework by occupation, but no European source counts meetings by role. Executive hours come from a US-centred HBR survey.
- Cost of meetings as a share of payroll. No statistical office, central bank, Eurofound report or peer-reviewed European paper publishes this. The widely quoted totals trace to press articles, not to a paper we could open. This page publishes the inputs and a labelled calculation instead.
- Action-item completion and forgotten decisions. No peer-reviewed study measures the share of meeting action items completed or decisions later forgotten. Every "44% of action items are never completed" figure online traces to meeting-software blogs, which were excluded.
- Legal and consulting. No primary source with a stated sample quantifies the meeting time or hybrid rates of lawyers or consultants.
- Figures often attributed to Perlow, Hadley and Eun (2017). The 65%, 71%, 64% and 62% figures commonly cited from this article do not appear in it. The verified figures are 17%, 54% and nearly 23 hours a week.
About this page
This page is maintained by VoiceCap, the AI notetaker that becomes your company's memory, as a public reference. VoiceCap's own product data is not used for any statistic on this page. Corrections with a primary source are welcome at the address on the contact page. If you republish a figure, cite its original publisher and year.
Sources
All sources were opened and checked on 13 September 2026.
Telework and hybrid work
- Eurostat, Employed persons working from home (dataset lfsa_ehomp), EU Labour Force Survey
- European Commission, second-stage consultation of social partners on the right to disconnect and fair telework, 25 July 2025
- European Commission, consultation document C(2025) 7020 (PDF)
- European Commission Joint Research Centre, Who can telework today? The teleworkability of occupations in the EU, 2020 (PDF)
- Office for National Statistics, Who has access to hybrid work in Great Britain?, June 2025
- Office for National Statistics, Who are the hybrid workers?, November 2024
- CIPD, Flexible and hybrid working practices, 2025
- Destatis, press release on working from home, April 2026 (in German)
- ifo Institute, Working-from-home rate in Germany stabilizes just under 25 percent, March 2025
- INSEE, telework in the private sector, 2024 (in French)
- CBS, working from home in the Netherlands, November 2024 (in Dutch)
- Statistics Sweden, Labour Force Survey 2025, theme: working from home (in Swedish)
- Statistics Norway, working from home, 2025 (in Norwegian)
- Statistics Denmark, working from home, Q2 2024 (in Danish)
- Statistics Finland, remote work in 2024, 2025 (in Finnish)
- Central Statistical Bureau of Latvia, employees working remotely, 2025 (in Latvian)
- Eurofound, Living and working in Europe 2024: Telework in transition
- Eurofound, A new world of work: European Working Conditions Survey 2024 first findings
- EU-OSHA, ESENER 2024 press release
- Owl Labs, State of Hybrid Work UK 2025 (vendor survey)
- Owl Labs, State of Hybrid Work Germany 2024 (vendor survey, in German)
- Owl Labs, State of Hybrid Work France 2024 (vendor survey, in French)
Meetings and meeting load
- Eurostat, enterprises holding remote meetings via the internet, May 2025
- Bitkom, eight video calls a day on average, January 2021 (in German)
- Microsoft Work Trend Index, The Next Great Disruption Is Hybrid Work, March 2021
- Microsoft Work Trend Index, Great Expectations: Making Hybrid Work Work, March 2022
- Microsoft Work Trend Index, Hybrid Work Is Just Work, September 2022
- Microsoft Work Trend Index, Will AI Fix Work?, May 2023
- Microsoft Work Trend Index, Breaking Down the Infinite Workday, June 2025
- DeFilippis, Impink, Singell, Polzer and Sadun, NBER Working Paper 27612, 2020 (PDF)
- Yang et al., The effects of remote work on collaboration among information workers, Nature Human Behaviour, 2022 (journal paywalled)
- Gibbs, Mengel and Siemroth, IZA Discussion Paper 14336, 2021 (PDF)
- Perlow, Hadley and Eun, Stop the Meeting Madness, Harvard Business Review, July–August 2017 (paywalled)
- Rogelberg, Allen, Shanock, Scott and Shuffler, Human Resource Management, 2010 (author PDF)
- Slack Workforce Index, after-hours work and productivity, 2023 (vendor survey)
- Doodle, The State of Meetings 2019 (vendor survey)
- Atlassian, Workplace Woes: Meetings, 2024 (vendor survey)
- Atlassian, State of Teams 2024 (vendor survey)
- Gallup, US employee engagement, 2024
Cost, hours and pay
- Eurostat, hourly labour costs 2025, 31 March 2026
- Eurostat, labour cost levels (dataset lc_lci_lev)
- Eurostat, Structure of Earnings Survey 2022 (dataset earn_ses22_28)
- Eurostat, actual weekly working hours 2024, May 2025
- OECD, average annual hours actually worked per worker (data API)
- Eurostat, Wage determinants in the EU, 2025 (PDF)
Sectors and regulation
- CFA Institute, Future of work in investment management, 2021
- NHS England, NHS Staff Survey 2025 national results briefing (PDF)
- EUR-Lex, Working Time Directive 2003/88/EC
- Eurofound, Right to disconnect: implementation and impact at company level, 2023 (PDF)
- Eurofound, Trends in job quality: European Working Conditions Survey 2024
- EU-OSHA, OSH Pulse 2022 summary (PDF)
Written by
Rokas Jurkenas